Politics and Covid-19


Politics and Covid-19 Ohio

I largely avoid politics here because it’s a much more subjective topic that is far less data-focused in nature than what I try to provide here, so the most political I’ve gotten was to provide past election results and county voting trends with no political commentary. This post will attempt to maintain that line between data and opinion, but I understand that the topic of politics and Covid-19 is already a very controversial mix, and simply sticking to the data won’t necessarily be perceived as unbiased by all who read this. With that in mind, I can only say that this post is based on existing, straightforward data, and I have made no attempts to add any personal biases to the results one way or another.
With all that said, I was curious whether there was any correlation between voting patterns and Covid cases/deaths locally, specifically with Ohio’s 88 counties. There has been some suggestion in the media that Red- or Republican-voting places- have generally had worse outcomes than Blue- or Democratic-voting counties. So we will look at the following factors to see if that holds true locally:
1. Total Cases
2. Total Cases Per Capita
3. Total Deaths
4. Total Deaths Per Capita

But we first must establish what the Red vs. Blue counties are. Ohio doesn’t register voters by party affiliation, so instead, I used county voting results for the past 6 presidential elections, or since 2000. Based on the % of voters voting for either Republican or Democrat, I created 5 different levels of political bias.
Deep Blue: Counties where Democratic voters beat Republican voters by 25 points or more.
Light Blue: Counties where Democratic voters beat Republican voters by 5-24 points.
Neutral: Counties where Democratic/Republican voter advantage falls under 5 points.
Light Red: Counties where Republican voters beat Democratic voters by 5-24 points.
Deep Red: Counties where Republican voters beat Democratic voters by 25 points or more.
The point system is taken from the average of the past 6 elections, so keep in mind that some counties may be more Red or Blue currently than the average suggests.

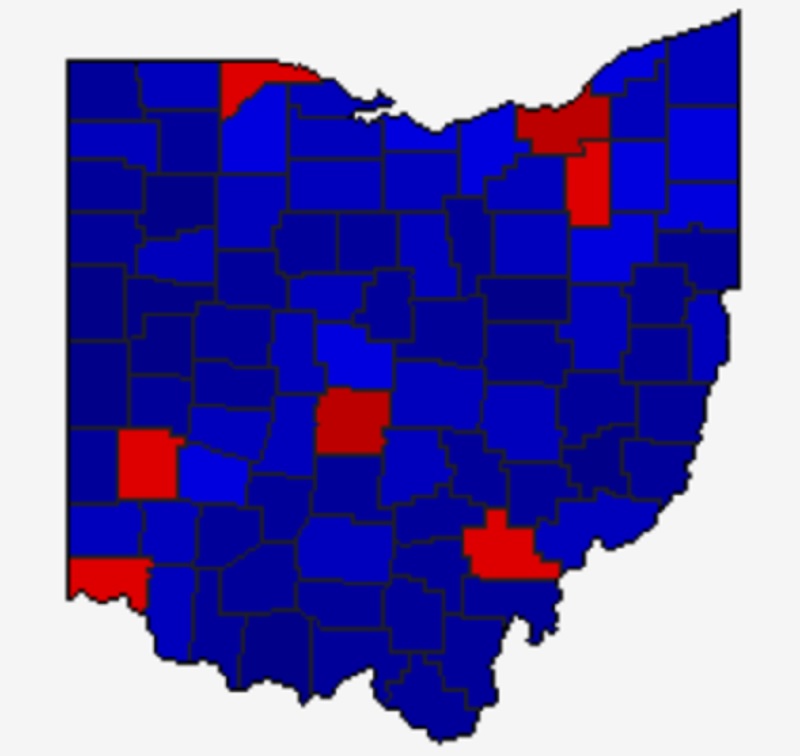
So based on that criteria, which Ohio counties are Red vs. Blue vs. Neutral? Well, Ohio’s overwhelming rural counties are mostly in the Deep Red category (39 of 88), followed by Light Red (34 of 88), Neutral (7 of 88), Light Blue (7 of 88) and just 1 Deep Blue county in the state. The map below breaks the counties down and gives the average voting bias across the last 6 elections.

Now we need to take those established voting biases and compare them to how the counties performed during Covid-19.
Case Numbers Through 3/31/2022
Total All Red Counties: 1,230,285
Total All Neutral Counties: 498,375
Total All Blue Counties: 944,141
Average Total Cases by County Group
Deep Red Counties: 15,138.8
Light Red Counties: 18,819.8
Neutral Counties: 71,196.4
Light Blue Counties: 96,563.6
Deep Blue County: 268,196
On first glance, it would seem that Red counties did much better on average despite having more cases overall, but the problem is that those counties have much lower populations and literally cannot have the same average totals of more populated ones. That’s why we instead have to look at per-capita cases.
Total Cases Per 100K People
All Red Counties: 23.9
All Neutral Counties: 22.8
All Blue Counties: 21.9
Deep Red Only: 23.7
Light Red Only: 24.0
Neutral Only: 22.8
Light Blue Only: 22.0
Deep Blue Only: 21.7
With per-capita, the story is exactly the opposite, with Red counties having more cases by population. If you’re wondering why the Deep Red counties had a slightly lower per-capita rate than Light Red, the answer is Holmes County. Perhaps due to its heavy Amish population that tends to avoid modern medicine and technology- and largely keep to themselves in the process- reported per-capita cases there were the lowest in the state by far, and single-handedly lowered the entire Deep Red county grouping below Light Red counties. Regardless, the outcome was still the same- Red did worse.
Top 10 Highest Per-Capita Case Rate
1. Marion: 30.5
2. Lawrence, Scioto: 30.0
3. Pickaway: 29.9
4. Muskingum: 29.3
5. Jackson: 27.4
6. Fayette: 27.3
7. Guernsey: 26.9
8. Allen, Defiance, Pike: 26.8
9. Union: 26.4
10. Clark, Erie: 26.1
Top 10 Lowest Per-Capita Case Rate
1. Holmes: 11.6
2. Geauga: 17.1
3. Carroll: 19.5
4. Wayne: 20.0
5. Meigs: 20.1
6. Ashtabula: 20.3
7. Washington: 20.6
8. Summit: 20.7
9. Ottawa: 20.9
10. Trumbull: 21
Of course, one of the caveats with this data is that many, many cases went unreported, and those cases were more likely to be in rural areas with lower access to testing and medical facilities. There’s also the issue that Covid doesn’t always present with symptoms. So, it’s possible that the per-capita discrepancy was even larger.
Deaths, however, are more concrete. Not all of them have been counted either, obviously, but it’s a lot harder to hide a death than it is a symptomless case.
Total Deaths Through 3/31/2022
All Red Counties: 18,295
All Neutral Counties: 7,219
All Blue Counties: 12,523
Average Total Deaths by County Group
Deep Red: 227.6
Light Red: 277.0
Neutral: 1,031.3
Light Blue: 1,253.3
Deep Blue: 3,750.0
Again, on the surface, the average looks bad for Blue counties despite having the lower overall total, but the truth again rests with the per-capita figures.
Total Deaths Per Capita by County Group
Deep Red: 394.4
Light Red: 390.4
Neutral: 345.4
Light Blue: 328.6
Deep Blue: 304.0
On a per-capita basis, Blue counties lost 76 fewer people per 100K than did Red counties. That’s a lot of lives.

So what can be concluded from all this? The first is that the results in Ohio were not isolated. Across almost all states, Blue-leaning states had better outcomes per-capita than Red. Speculation as to why that is runs the gamut, from better overall local policies to differing views on science to even education levels and access to harmful media sources that disseminate misinformation. Whatever the case may be, the United States has lost more people than any other nation in the world, at now over 1 million. It is by far the worst pandemic and the worst natural disaster in American history. With so much bad news these days, we can only hope that something valuable has been learned in all this terrible mess.

Today in History Prohibition Party Convention


This occasional series will focus on interesting or important dates in Columbus history, with today’s being the 1919 Prohibition Party Convention.

February 22, 1872
A convention of the Prohibition Party was convened at the Opera House to discuss ways in which to enact legislation banning the manufacturing and sale of alcohol. Such conventions had taken place at least 8 times in the previous 40 years, but was the first such event since 1869. The 1869 event in Chicago formed the Prohibition Party itself, so the Columbus event could be described as the first convention of the new political party.

The event was attended by about 25 delegates from 12 states. Those in attendance included Gideon T. Stewart, then a prohibition candidate for Ohio governor. Stewart gave the welcoming speech. In it, he described the prohibition movement as an attempt to “protect the interests of humanity” and that due to the government’s involvement in the sale of liquor, was “fast verging towards the precipice over which other governments have swept to destruction”.

cool link prohibition party convention

Gideon Steward around 1900.

Stewart was elected as the party secretary during the convention. The 1872 convention was also the first the party nominated candidates for US president.

During the event, it was ironically noted that Columbus itself benefitted greatly from alcohol sales, and functioned as “one of the foremost benefactors of the world” in that regard. Columbus did have multiple breweries at the time- most in the Brewery District, of course- but it cannot be verified if Columbus was indeed special in either its alcohol consumption or sales compared to other cities.
In 1919, the Prohibition Party was ultimately successful in establishing nationwide prohibition by assisting in the passage of the 18th Amendment to the Constitution. This victory, however, proved somewhat pyrrhic in nature as the 18th was repealed by 1933 and the Party suffered a long-lasting blow to its reputation. It was never again quite able to gain such a prominent role in leading national public policy. For a political movement driven by such a singular issue, it is perhaps surprising that the Prohibition Party is still in existence today, though its influence even as a 3rd party is now virtually non-existent.

The modern logo of the Prohibition Party.


Today in History: The First Columbus Gay Pride


Depending on the source, the first official Columbus Gay Pride event was held in either June 1981 or June 1982. Going through newspaper and other records, it does seem like the first official Pride Parade in Columbus occurred on June 26, 1982. There were smaller demonstrations prior to 1982, but nothing officially recognized. In the 1970s, before events became more commonplace, small marches would take place through Downtown. Some participants of those early events would wear bags over their heads so that they would not be recognized. Very few protections, if any, existed for the LGBT community then, so a public outing could be very detrimental to someone’s life. In 1982, Columbus City Council passed a resolution recognizing Gay Pride Week 13 years after the Stonewall Riots, and allowed the parade to take place. The City had been somewhat of an early adoptee of LGBT equality when, in 1974, it passed an ordinance expanding housing and other public accommodation protections based on sexual orientation.

Columbus Ohio gay pride

The 1982 parade.

Between 500-1000 people showed up to Columbus’ first Pride. The group took a route from Goodale Park, down Front Street and eventually to Capitol Square for a rally. The first parade was somewhat low key compared to today’s enormous party atmosphere. Participants carried signs, sang songs and waved American flags. The now iconic rainbow flag had only existed since 1978 and was not yet in widespread use.
The parade faced surprisingly few hecklers along the route for a time in which support for LGBT equality was very much a minority position within the greater population. Some local churches organized small protest groups that shouted at the crowd to repent, but were booed down by the parade- a scene that unfortunately continues to the present day.

These brave participants helped pave the way for what is now one the largest such events in the nation and possibly the world. From less than 1000 marchers and spectators, the still-growing event now attracts in excess of half a million. Based on global statistics, this would put Columbus’ Pride in the top 25 largest in the world and around 8th in the United States.

Happy Pride!

For more information on local Pride history and events, as well as LGBT resources, visit the following:
Stonewall Columbus
LGBT Resources
LGBT Health Resources


Cool Link: 2020 National Election Results by Precinct


election results by precinct

The New York Times has released a national, interactive map of election results by precinct. You can view voting totals and percentages, as well as whether precincts moved further right or left 2016 to 2020.

NYT Voting Precinct Map

To see more information on local and national election results check out these links:
2020 Ohio County Election Results
US Election Atlas

Follow my blog with Bloglovin

2020 Election Results for Columbus Metro Counties


2020 election results

Although Ohio is technically still counting some votes, there shouldn’t be any significant movement in the overall numbers, so we can now take a look at how the local area voted down to the precinct level. In this post, though, the focus is on 2020 election results for Columbus metro counties, as well as past elections going back to 2000.

First, here are the voting total breakdowns by every metro county since 2000.

Delaware County
Total Votes By Election
2020: 126,374
2016: 105,639
2012: 98,899
2008: 92,581
2004: 80,456
2000: 55,403
Fairfield County
2020: 81,598
2016: 73,554
2012: 72,220
2008: 72,147
2004: 67,882
2000: 54,094
Franklin County
2020: 632,532
2016: 587,524
2012: 572,188
2008: 561,763
2004: 525,827
2000: 414,074
Hocking County
2020: 13,860
2016: 12,929
2012: 12,768
2008: 13,016
2004: 13,199
2000: 10,756
Licking County
2020: 94,396
2016: 83,624
2012: 81,550
2008: 82,570
2004: 79,420
2000: 62,466
Madison County
2020: 19,887
2016: 17,421
2012: 17,557
2008: 17,510
2004: 17,398
2000: 14,667
Morrow County
2020: 18,468
2016: 16,688
2012: 16,217
2008: 16,679
2004: 16,328
2000: 12,839
Perry County
2020: 16,676
2016: 15,101
2012: 15,020
2008: 15,437
2004: 15,189
2000: 12,828
Pickaway County
2020: 28,326
2016: 24,912
2012: 24,154
2008: 23,787
2004: 22,852
2000: 17,740
Union County
2020: 33,535
2016: 27,695
2012: 25,623
2008: 24,984
2004: 22,631
2000: 17,024

Total Metro Area
2020: 1,065,652
2016: 965,087
2012: 936,196
2008: 920,474
2004: 861,182
2000: 671,891

All of Columbus’ metro counties saw at or near record turnout levels, but also just high general vote totals. The metro added almost 400,000 total voters since 2000, partly explained by the area’s population growth.

Now let’s look at a breakdown of partisanship by total votes. With the margins, positive numbers are Republican, negative numbers are Democratic, again since 2000.

Delaware County
Democratic Votes
2020: 57,735
2016: 40,872
2012: 37,292
2008: 36,653
2004: 27,048
2000: 17,134
Republican Votes
2020: 66,356
2016: 57,568
2012: 60,194
2008: 54,778
2004: 53,143
2000: 36,639
Partisan Margin
2020: +8,621
2016: +16,696
2012: +22,902
2008: +18,125
2004: +26,095
2000: +19,505
Fairfield County
Democratic Votes
2020: 30,634
2016: 24,881
2012: 29,890
2008: 29,250
2004: 24,783
2000: 19,065
Republican Votes
2020: 49,714
2016: 44,314
2012: 41,034
2008: 41,580
2004: 42,715
2000: 33,523
Partisan Margin
2020: +19,080
2016: +19,433
2012: +11,144
2008: +12,330
2004: +17,932
2000: +14,458
Franklin County
Democratic Votes
2020: 409,144
2016: 351,198
2012: 346,373
2008: 334,709
2004: 285,801
2000: 202,018
Republican Votes
2020: 211,237
2016: 199,331
2012: 215,997
2008: 218,486
2004: 237,253
2000: 197,862
Partisan Margin
2020: -197,907
2016: -151,867
2012: -130,376
2008: -116,223
2004: -48,548
2000: -4,156
Hocking County
Democratic Votes
2020: 3,880
2016: 3,775
2012: 6,157
2008: 6,259
2004: 6,175
2000: 4,474
Republican Votes
2020: 9,737
2016: 8,497
2012: 6,285
2008: 6,364
2004: 6,936
2000: 5,702
Partisan Margin
2020: +5,857
2016: +4,722
2012: +128
2008: +105
2004: +761
2000: +1,228
Licking County
Democratic Votes
2020: 33,055
2016: 27,376
2012: 34,201
2008: 33,932
2004: 30,053
2000: 23,196
Republican Votes
2020: 59,514
2016: 51,241
2012: 45,503
2008: 46,918
2004: 49,016
2000: 37,180
Partisan Margin
2020: +26,459
2016: +23,865
2012: +11,302
2008: +12,986
2004: +18,963
2000: +13,984
Madison County
Democratic Votes
2020: 5,698
2016: 4,779
2012: 6,845
2008: 6,532
2004: 6,203
2000: 5,287
Republican Votes
2020: 13,835
2016: 11,631
2012: 10,342
2008: 10,606
2004: 11,117
2000: 8,892
Partisan Margin
2020: +8,137
2016: +6,852
2012: +3,497
2008: +4,074
2004: +4,914
2000: +3,605
Morrow County
Democratic Votes
2020: 4,048
2016: 3,761
2012: 5,933
2008: 6,177
2004: 5,775
2000: 4,529
Republican Votes
2020: 14,077
2016: 11,948
2012: 9,865
2008: 10,067
2004: 10,474
2000: 7,842
Partisan Margin
2020: +10,029
2016: +8,187
2012: +3,932
2008: +3,890
2004: +4,699
2000: +3,313
Perry County
Democratic Votes
2020: 4,098
2016: 4,138
2012: 7,033
2008: 7,261
2004: 7,257
2000: 5,895
Republican Votes
2020: 12,357
2016: 10,228
2012: 7,627
2008: 7,721
2004: 7,856
2000: 6,440
Partisan Margin
2020: +8,259
2016: +6,090
2012: +594
2008: +460
2004: +599
2000: +545
Pickaway County
Democratic Votes
2020: 7,304
2016: 6,529
2012: 9,684
2008: 9,077
2004: 8,579
2000: 6,598
Republican Votes
2020: 20,593
2016: 17,076
2012: 14,037
2008: 14,228
2004: 14,161
2000: 10,717
Partisan Margin
2020: +13,289
2016: +10,547
2012: +4,353
2008: +5,151
2004: +5,582
2000: +4,119
Union County
Democratic Votes
2020: 11,141
2016: 7,718
2012: 8,805
2008: 8,761
2004: 6,665
2000: 5,040
Republican Votes
2020: 21,669
2016: 18,096
2012: 16,289
2008: 15,744
2004: 15,870
2000: 11,502
Partisan Margin
2020: +10,528
2016: +10,378
2012: +7,484
2008: +6,983
2004: +9,205
2000: +6,462

Only 3 metro counties- Delaware, Fairfield and Franklin- moved further blue since 2016. Franklin and Delaware moved strongly left, Fairfield only slightly. Delaware and Franklin also moved more blue from 2012 to 2016. Union stayed very similar to 2016. Delaware and Franklin are the 2 most urbanized counties in the metro, so it makes sense they moved bluer. The most rural counties tended to have the strongest movement to the right.

Total Metro Area
Democratic Votes
2020: 566,737
2016: 475,027
2012: 492,213
2008: 478,611
2004: 408,339
2000: 293,236
Republican Votes
2020: 479,089
2016: 429,930
2012: 427,173
2008: 426,492
2004: 448,541
2000: 356,299

2020 was the first election in which either party surpassed half a million votes.

Metro Area Margin Between Democratic and Republican Votes (Negative is Democrat, Positive is Republican)
2020: -87,648
2016: -45,097
2012: -65,040
2008: -52,119
2004: +40,202
2000: +63,063

2020 provided the largest margin for either party since 2000, and the metro has generally become more blue over time.


And here is the partisan vote breakdown by % since 2000.
Delaware County
Democratic
2020: 45.69%
2016: 38.69%
2012: 37,71%
2008: 39.59%
2004: 33.62%
2000: 30.93%
Republican
2020: 52.51%
2016: 54.50%
2012: 60.86%
2008: 59.17%
2004: 66.05%
2000: 66.13%
Fairfield County
Democratic
2020: 37.54%
2016: 33.83%
2012: 41.39%
2008: 40.54%
2004: 36.51%
2000: 35.24%
Republican
2020: 60.93%
2016: 60.25%
2012: 56.82%
2008: 57.63%
2004: 62.93%
2000: 61.97%
Franklin County
Democratic
2020: 64.68%
2016: 59.78%
2012: 60.53%
2008: 59.58%
2004: 54.35%
2000: 48.79%
Republican
2020: 33.40%
2016: 33.93%
2012: 37.75%
2008: 38.89%
2004: 45.12%
2000: 47.78%
Hocking County
Democratic
2020: 27.99%
2016: 29.20%
2012: 48.22%
2008: 48.09%
2004: 46.78%
2000: 41.60%
Republican
2020: 70.25%
2016: 65.72%
2012: 49.22%
2008: 48.89%
2004: 52.55%
2000: 53.01%
Licking County
Democratic
2020: 35.02%
2016: 32.74%
2012: 41.94%
2008: 41.09%
2004: 37.84%
2000: 37.13%
Republican
2020: 63.05%
2016: 61.28%
2012: 55.80%
2008: 56.82%
2004: 61.72%
2000: 59.52%
Madison County
Democratic
2020: 28.65%
2016: 27.43%
2012: 38.99%
2008: 37.30%
2004: 35.65%
2000: 36.05%
Republican
2020: 69.57%
2016: 66.76%
2012: 58.91%
2008: 60.57%
2004: 63.90%
2000: 60.63%
Morrow County
Democratic
2020: 21.92%
2016: 22.54%
2012: 36.59%
2008: 37.03%
2004: 35.37%
2000: 35.28%
Republican
2020: 76.22%
2016: 71.60%
2012: 60.83%
2008: 60.36%
2004: 64.15%
2000: 61.08%
Perry County
Democratic
2020: 24.57%
2016: 27.40%
2012: 46.82%
2008: 47.04%
2004: 47.78%
2000: 45.95%
Republican
2020: 74.10%
2016: 67.73%
2012: 50.78%
2008: 50.02%
2004: 51.72%
2000: 50.20%
Pickaway County
Democratic
2020: 25,79%
2016: 26.21%
2012: 40.09%
2008: 38.16%
2004: 37.54%
2000: 37.19%
Republican
2020: 72.70%
2016: 68.55%
2012: 58.11%
2008: 59.81%
2004: 61.97%
2000: 60.41%
Union County
Democratic
2020: 33.22%
2016: 27.87%
2012: 34.36%
2008: 35.07%
2004: 29.45%
2000: 29.61%
Republican
2020: 64.62%
2016: 65.34%
2012: 63.57%
2008: 63.02%
2004: 70.13%
2000: 67.56%

Metro Area Partisan % By Year
Democratic
2020: 53.18%
2016: 49.22%
2012: 52.58%
2008: 52.00%
2004: 47.42%
2000: 43.64%
Republican
2020: 44.96%
2016: 44.55%
2012: 45.63%
2008: 46.33%
2004: 52.08%
2000: 53.03%

% Margin Between Democratic and Republican Vote (Negative is Democratic, Positive is Republican)
2020: -8.22
2016: -4.67
2012: -6.95
2008: -5.67
2004: +4.66
2000: +9.39

To see national election results back to the 1700s, visit here:
US Election Atlas