Politics and Ohio’s Economic Performance

Politics and Ohio's economic performance

For this post, I want to focus on politics and Ohio’s economic performance in relation to the party in power. There’s been much said over whether the economy does better under Republicans or Democrats at the national level, and I wanted to see if national politics played any role in the economic performance of Columbus and Ohio overall. Now, to put it simply, I really just looked at Bureau of Labor Statistics to see how the economy performed under different administrations. It’s not necessarily going to be a very deep analysis beyond that. In recent surveys, many user responses chose political content as something I should contribute to the site more often. While I do not want to make the site overtly political, I think there can be a balance by using a data-driven approach. This is what I used in past posts relating to politics, from Covid numbers to voting totals.

In any case, we have to determine what administrations we’re going to look at. First, the criteria is that they have to be completed adminisrations, as we will look at entire 4-year periods. The data for the BLS for Ohio goes back to 1976, but only to 1990 for Columbus itself. Therefore, for the state we will use Carter, Reagan, Bush, Clinton, Bush II, Obama and Trump for the state numbers, and Clinton, Bush II, Obama and Trump for city numbers. Will the state numbers follow the same patterns as the city, or not?

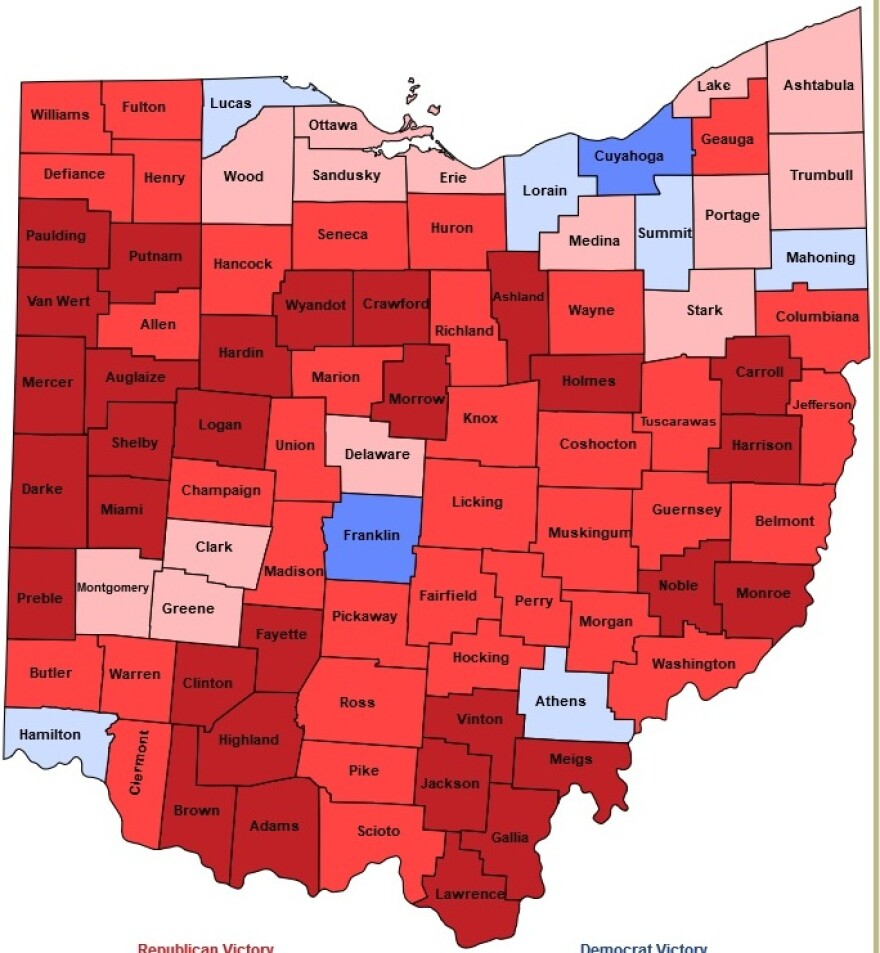
For this post, it’s all about Ohio.

Let’s look at the overall stats of each president. These will be Labor Force (people within the job market), Employment (people in the labor force with jobs), Unemployment (people in the labor force without jobs), and Unemployment Rate (percent of the labor force without jobs).

State of Ohio

Labor Force Data

President

Figure at Term Beginning

Figure at Term End

Net Change

% Change

Jimmy Carter (D)

1/1977-1/1981

4,781,086

5,085,673

+304,587

+6.37

Ronald Reagan (R)

1st Term

1/1981-1/1985

5,085,673

5,088,875

+3,202

+0.06

Ronald Reagan (R)

2nd Term

1/1985-1/1989

5,088,875

5,316,349

+227,474

+4.47

George H.W. Bush (R)

1/1989-1/1993

5,316,349

5,478,918

+162,569

+3.06

Bill Clinton (D)

1st Term

1/1993-1/1997

5,478,918

5,684,684

+205,766

+3.76

Bill Clinton (D)

2nd Term

1/1997-1/2001

5,684,684

5,802,000

+117,316

+2.06

George W. Bush (R)

1st Term

1/2001-1/2005

5,802,000

5,851,991

+49,991

+0.86

George W. Bush (R)

2nd Term

1/2005-1/2009

5,851,991

5,960,636

+108,645

+1.86

Barack Obama (D)

1st Term

1/2009-1/2013

5,960,636

5,705,642

-254,994

-4.28

Barack Obama (D)

2nd Term

1/2013-1/2017

5,705,642

5,791,153

+85,511

+1.50

Donald Trump (R)

1st Term

1/2017-1/2021

5,791,153

5,720,805

-70,348

-1.21

Joe Biden (D)

1/2021-1/2025

5,720,805

5,922,243

+201,438

+3.52


Total Labor Force Change by Entire Presidency
1. Bill Clinton: +323,082
2. Jimmy Carter: +304,587
3. Ronald Reagan: +232,676
4. Joe Biden: +201,438
5. George H.W. Bush: +162,569
6. George W. Bush: +158,636
7. Donald Trump: -70,348
8. Barack Obama: -169,483
Total by Party
Democratic: +659,624
Republican: +483,533

Next up, Employment.

State of Ohio

Employment Data

President

Figure at Term Beginning

Figure at Term End

Net Change

% Change

Jimmy Carter (D)

1/1977-1/1981

4,423,538

4,629,708

+206,170

+4.66

Ronald Reagan (R)

1st Term

1/1981-1/1985

4,629,708

4,633,809

4,101

+0.09

Ronald Reagan (R)

2nd Term

1/1985-1/1989

4,633,809

5,032,921

+399,112

+8.61

George H.W. Bush (R)

1/1989-1/1993

5,032,921

5,092,311

+59,390

+1.18

Bill Clinton (D)

1st Term

1/1993-1/1997

5,092,311

5,396,922

+304,611

+5.98

Bill Clinton (D)

2nd Term

1/1997-1/2001

5,396,922

5,577,863

+180,941

+3.35

George W. Bush (R)

1st Term

1/2001-1/2005

5,577,863

5,484,332

-93,531

-1.68

George W. Bush (R)

2nd Term

1/2005-1/2009

5,484,332

5,437,168

-47,164

-0.86

Barack Obama (D)

1st Term

1/2009-1/2013

5,437,168

5,279,345

-157,823

-2.90

Barack Obama (D)

2nd Term

1/2013-1/2017

5,279,345

5,489,730

+210,385

+3.99

Donald Trump (R)

1st Term

1/2017-1/2021

5,489,730

5,370,247

-119,483

-2.18

Joe Biden (D)

1/2021-1/2025

5,370,247

5,651,168

+280,921

+5.23


Total Employment Change by Entire Presidency
1. Bill Clinton: +485,552
2. Ronald Reagan: +403,213
3. Joe Biden: +280,921
4. Jimmy Carter: +206,170
5. George H.W. Bush: +59,390
6. Barack Obama: +52,562
7. Donald Trump: -119,483
8. George W. Bush: -140,695
Total by Party
Democratic: +1,025,205
Republican: +202,425

Now Unemployment.

State of Ohio

Unemployment Data

President

Figure at Term Beginning

Figure at Term End

Net Change

% Change

Jimmy Carter (D)

1/1977-1/1981

357,548

455,965

+98,417

+27.53

Ronald Reagan (R)

1st Term

1/1981-1/1985

455,965

455,066

-899

-0.2

Ronald Reagan (R)

2nd Term

1/1985-1/1989

455,066

283,428

-171,638

-37.72

George H.W. Bush (R)

1/1989-1/1993

283,428

386,607

+103,179

+36.40

Bill Clinton (D)

1st Term

1/1993-1/1997

386,607

287,762

-98,845

-25.57

Bill Clinton (D)

2nd Term

1/1997-1/2001

287,762

224,137

-63,625

-22.11

George W. Bush (R)

1st Term

1/2001-1/2005

224,137

367,659

+143,522

+64.03

George W. Bush (R)

2nd Term

1/2005-1/2009

367,659

523,468

+155,809

+42.38

Barack Obama (D)

1st Term

1/2009-1/2013

523,468

426,297

-97,171

-18.56

Barack Obama (D)

2nd Term

1/2013-1/2017

426,297

301,423

-124,874

-29.29

Donald Trump (R)

1st Term

1/2017-1/2021

301,423

350,558

+49,135

+16.30

Joe Biden (D)

1/2021-1/2025

350,558

271,075

-79,483

-22.67


Total Unemployment Change by Entire Presidency
1. Barack Obama: -222,045
2. Ronald Reagan: -172,537
3. Bill Clinton: -162,470
4. Joe Biden: -79,483
5. Donald Trump: +49,135
6. Jimmy Carter: +98,417
7. George H.W. Bush: +103,179
8. George W. Bush: +299,331
Total by Party
Democratic: -365,581
Republican: +279,108

And finally, the Unemployment Rate

State of Ohio

Unemployment Rate Data

President

Figure at Term Beginning

Figure at Term End

Net Change

Jimmy Carter (D)

1/1977-1/1981

7.5

9.0

+1.5

Ronald Reagan (R)

1st Term

1/1981-1/1985

9.0

8.9

-0.1

Ronald Reagan (R)

2nd Term

1/1985-1/1989

8.9

5.3

-3.6

George H.W. Bush (R)

1/1989-1/1993

5.3

7.1

+1.8

Bill Clinton (D)

1st Term

1/1993-1/1997

7.1

5.1

-2.0

Bill Clinton (D)

2nd Term

1/1997-1/2001

5.1

3.9

-1.2

George W. Bush (R)

1st Term

1/2001-1/2005

3.9

6.3

+2.4

George W. Bush (R)

2nd Term

1/2005-1/2009

6.3

8.8

+2.5

Barack Obama (D)

1st Term

1/2009-1/2013

8.8

7.5

-1.3

Barack Obama (D)

2nd Term

1/2013-1/2017

7.5

5.2

-2.3

Donald Trump (R)

1st Term

1/2017-1/2021

5.2

6.1

+0.9

Joe Biden (D)

1/2021-1/2025

6.1

4.6

-1.5


Total Unemployment Rate Change by Entire Presidency
1. Ronald Reagan: -3.7
2. Barack Obama: -3.6
3. Bill Clinton: -3.2
4. Joe Biden: -1.5
5. Donald Trump: +0.9
6. Jimmy Carter: +1.5
7. George H.W. Bush: +1.8
8. George W. Bush: +4.9
Total by Party
Democratic: -6.8
Republican: +3.9

Presidents Ranked by Ohio Performance Overall Per Average Rank Position
1. Bill Clinton/Ronald Reagan: 2.0
2. Joe Biden: 3.75
3. Barack Obama: 4.25
4. Jimmy Carter: 4.5
5. Donald Trump: 6.0
6. George H.W. Bush: 7.0
7. George W. Bush: 7.5

It seems pretty clear based on this that Ohio does significantly better when Democrats are in the Oval Office. They produced 5x the number of jobs and moved the unemployment rate down by an average of -1.7 points, while Republicans moved it up by an average of almost 1 point. Every single metric measured by the BLS did better under Democrats. Only Reagan really stood out for Republicans while even Carter- regularly derided as a terrible president- did better than all 3 other Republicans on the list. In regards to the two most recent presidents from both parties, Biden clearly had much more favorable numbers than Trump did in his first term.

Now, does this trend translate to the more local level? In an upcoming post, I will examine how the Columbus Metro performed

Cool Link Housing Data Comparison

Housing data comparison

A view of permitted residential units in Ohio going back to 1980.

With the Housing Data App, users can access different types of housing data for the state, metro, county and city levels going back to 1980. The housing data comparison can be viewed view residential units permitted, total buildings permitted or overall property values. The data can also be view in total and per-capita.
Additionally, if you prefer, you can compare different cities or counties or states and see how their performance compares over time.

Columbus Casino Most Successful in State


After 4 previous tries, Ohio voters approved a constitutional amendment to allow casinos to operate in the state’s 4 largest cities. Three years after that 2009 vote, casinos began operations in Cleveland, Columbus and Toledo, with Cincinnati’s casino opening the following year in 2013.
The Columbus casino was originally supposed to be built Downtown in the Arena District. Specifically, it was supposed to be built where the Crew’s new stadium now sits. There was quite a bit of opposition to this plan given that casinos provide little to no external business traffic, and the thinking was that it would’ve caused more problems for the neighborhood than what it was worth.
So, the following year, a second statewide vote allowed for the Columbus casino to change locations to the West Side. The site that was chosen was the former Delphi plant, which had been closed since 2007. A bit of hypocrisy and irony was not lot in the demand to move the site, though. The West Side and Westland area were already in late state decline at that point, and proponents of the move claimed that the casino would help the area improve. This claim was made despite the fact that the move was initiated with the idea that it would’ve hurt the Arena District.
Still, the West Side seemed to be all for the move, as a new business- even a casino- was still better than a closed and deteriorating industrial plant.
Columbus’ Hollywood Casino opened on October 8, 2012 after about 2 years of site clearing and construction. While visions of the West Side raking in the benefits never really materialized in reality, the casino itself has gone on to great success in terms of revenue.

Initially, Cleveland- whose own Jack Casino was located in the heart of its downtown- was the highest earner by revenue in the state, Columbus passed it by 2016 and has been the state’s leader ever since.

Columbus casino Cincinnati vs Columbus

Columbus casino Cleveland vs Columbus

Columbus casino Toledo versus Columbus

All the casinos saw a 2020 drop as they were closed for 2 months and had hour restrictions into early 2021 due to the pandemic. Curiously, though, all of the casinos saw a huge increase in revenue over where they were in 2019. I’m not sure if that’s a good thing.

Housing Market Update January 2023


Housing market update January 2023

The Housing Market Update January 2023 data, the first of the new year, from Columbus Realtors showed that home sales and overall supply continued to decline, helping to ensure most areas saw continued increases in median prices.

Note: LSD= Local School District, CSD= City School District. In both cases, school district boundaries differ from city boundaries.

Housing Market Update January 2023 county closed sales
Housing market update January 2023 county closed sales % change
Closed sales are those sales that were completed during the month. 7 of the 10 metro counties saw declines in January
Housing market update January 2023 best closed sales
Housing market update January 2023 worst closed sales
Only 9 of more than 40 local markets were up year-over-year.
Housing market update January 2023 county median price
Housing market update January 2023 county median price change
Housing market update January 2023 median price % change
Not sure what was going on in Union County in January, but it was well above all other counties for the month. The market overall continued to be up on price year-over-year, except in Pickaway County.
Overall Market Median Sales Price in January 2023: $307,289
Based on the 10 Columbus Metro Area counties, the metro price saw a more than $39,000 increase over January, 2022.
Overall Market Median Sales Price % Change in January, 2023 vs. January, 2022: +14.6%
Continuing home sale declines had relatively little impact on home prices overall, which saw a strong increase over the year.
Housing market update January 2023 least expensive markets
Housing market update January 2023 most expensive markets
Housing market update January 2023 lowest market price change
Housing market update January 2023 highest market price change
It seems the Intel project’s impact may finally be making an appearance in housing numbers, with the Johnstown district seeing a huge increase in median home prices versus January 2022, 2 months before the project became official. That said, New Albany had one of the areas largest declines, but that could be due to it generally being one of the most expensive markets last year.
Housing market update January 2023 new listings by county
Housing market update January 2023 new listings change
New listings across most of the metro area were down, accounting for most of the median price increase as demand remains strong in the region. Most of the decrease came from Franklin County.
Total Metro New Listings in January, 2023: 1,612
Total Metro New Listings Change from January, 2022 to January, 2023: -316
Housing market update January 2023 most market listings
Housing market update January 2023 fewest market listings
Housing market update January 2023 county days on market
Housing market update January 2023 days on market change
Average # of Days Homes Remain on the Market Before Sale for the Metro Overall in January, 2023: 34.0
# of Days Homes Remain on the Market Before Sale for the Metro January, 2022 to January, 2023: +8.8

Homes continued to sell more slowly than they did a year ago, now more than a week more slowly on average.
Housing market update January 2023 fastest selling markets
Housing market update January 2023 slowest selling markets
Housing market update January 2023 market sale days increase
Housing market update January 2023 market sale days decline


Before and After Big Bear’s First Store

This edition of Before and After Big Bear’s First Store, we look at the chain’s original location. Big Bear grocery stores were founded in November, 1933 in Columbus. The first store in what would eventually become a significant regional chain, was located at 386 W. Lane Avenue.
The building was originally built as the “Crystal Slipper” ballroom, which opened in June, 1926. The ballroom was designed to hold 7,000 people and was called “America’s Most Beautiful Ballroom” by the developer, the Stadium Ovals Company. The ballroom itself was open less than a year, and the building was later used for various purposes into the early 1930s.
Before and After Big Bear's First Store The Crystal Slipper

The Crystal Slipper finishing construction in 1926.


Big Bear would purchase the building and renovate it into a grocery store over the winter of 1933-1934. The location subsequently opened on February 15, 1934. The 47,000 square foot store was said to have attracted 200,000 people on opening day, the success of which allowed the company to open a second store less than a year later.
Before: The first Big Bear store sometime in the late 1950s-early 1960s.
Before and After Big Bear's First Store
Big Bear was quite innovative for its time. It was the first self-serve supermarket in the Midwest and the first to use grocery conveyor belts for cashiers, for example.
The company eventually grew to include about 100 locations.
Ironically, a company that started as innovative ultimately failed because of a lack of innovation and maintenance of quality and service. In 1989, the company was purchased by Penn Traffic, a company that already owned several other chains in the Midwest. Unfortunately, it didn’t exactly have the cash to be buying the chain, and loaded Big Bear with debt. In 1993, newly-appointed CEO Philip Hawkins began cost-cutting measures. These measures included reducing staff and staff hours, and lowering product quality. Store conditions deteriorated and customers began choosing other supermarket chains.
By 2003, the company was being run into the ground. Customer volume had dropped to where the company could no longer pay vendors, so shelves were regularly empty of many products. This was the final death spiral. In 2004, Penn Traffic filed for bankruptcy and all remaining Big Bear stores were closed.
After: This 2021 image shows the site today.
Before and After Big Bear's First Store the location today
This particular location closed long before the company did- it closed in 1985 and the original building was demolished. Several years later, the current Riverwatch Tower was constructed on site.