
The 2015 housing market was one of the strongest since before the recession, and 2016 looks to do even better. An ongoing problem, especially within the more urban markets, is a historically low inventory of available homes for sale. This has been a problem for several years now, as construction has failed to match demand.

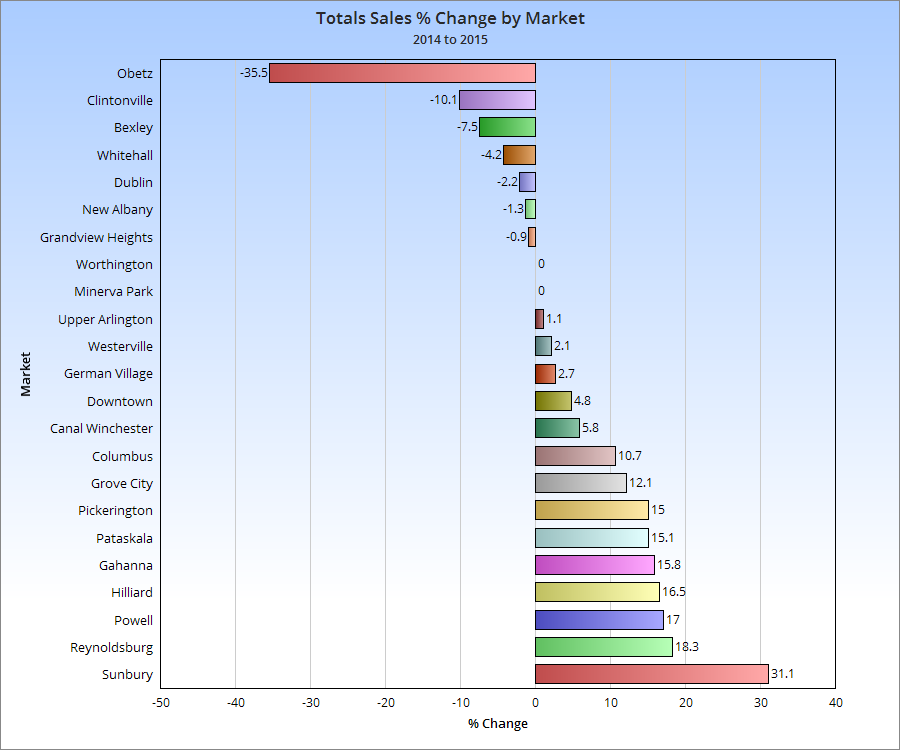
That lack of inventory really shows up in the yearly % change chart. Few urban markets have increased year over year, as they have a much more limited supply of housing, even as demand for urban housing has increased.
Let’s see how this impacted prices.
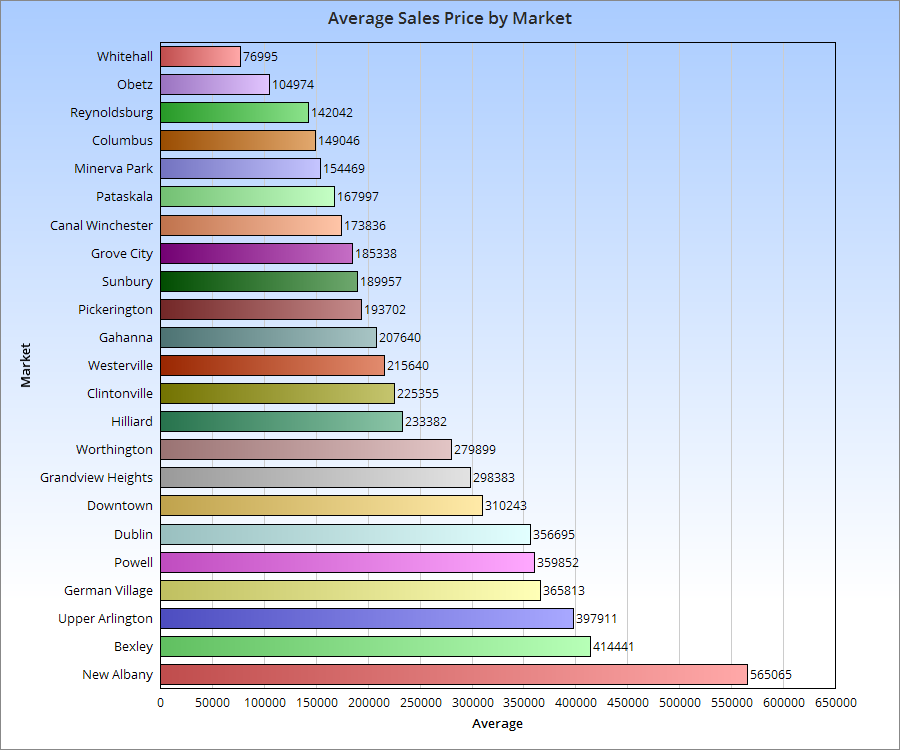
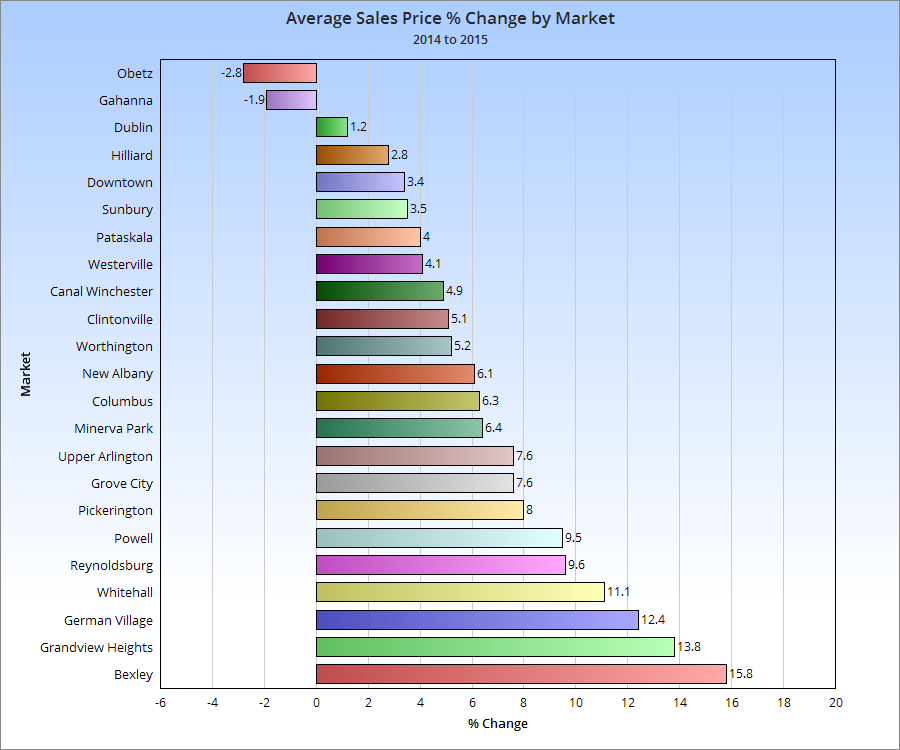
While urban markets were not necessarily the most expensive compared to suburban, more of them were generally towards the top half of price increases last year.