
Census tract maps on population, demographics, housing and just about any other type of statistic are available on this page. The maps go back as far as the data is available.
**Last Updated: 4/19/2025- Broke up the maps page into 4 different pages. There were simply too many maps trying to open on a single page, causing them to open very slowly or not at all. Hopefully, this move allows the maps to open more quickly, but further action may be needed.
If the maps don’t open on the site, use the “Open in Web Viewer” button on each.
Demographic Census Tract Maps
Density Census Tract Maps
Population Census Tract Maps
Other Census Tract Data
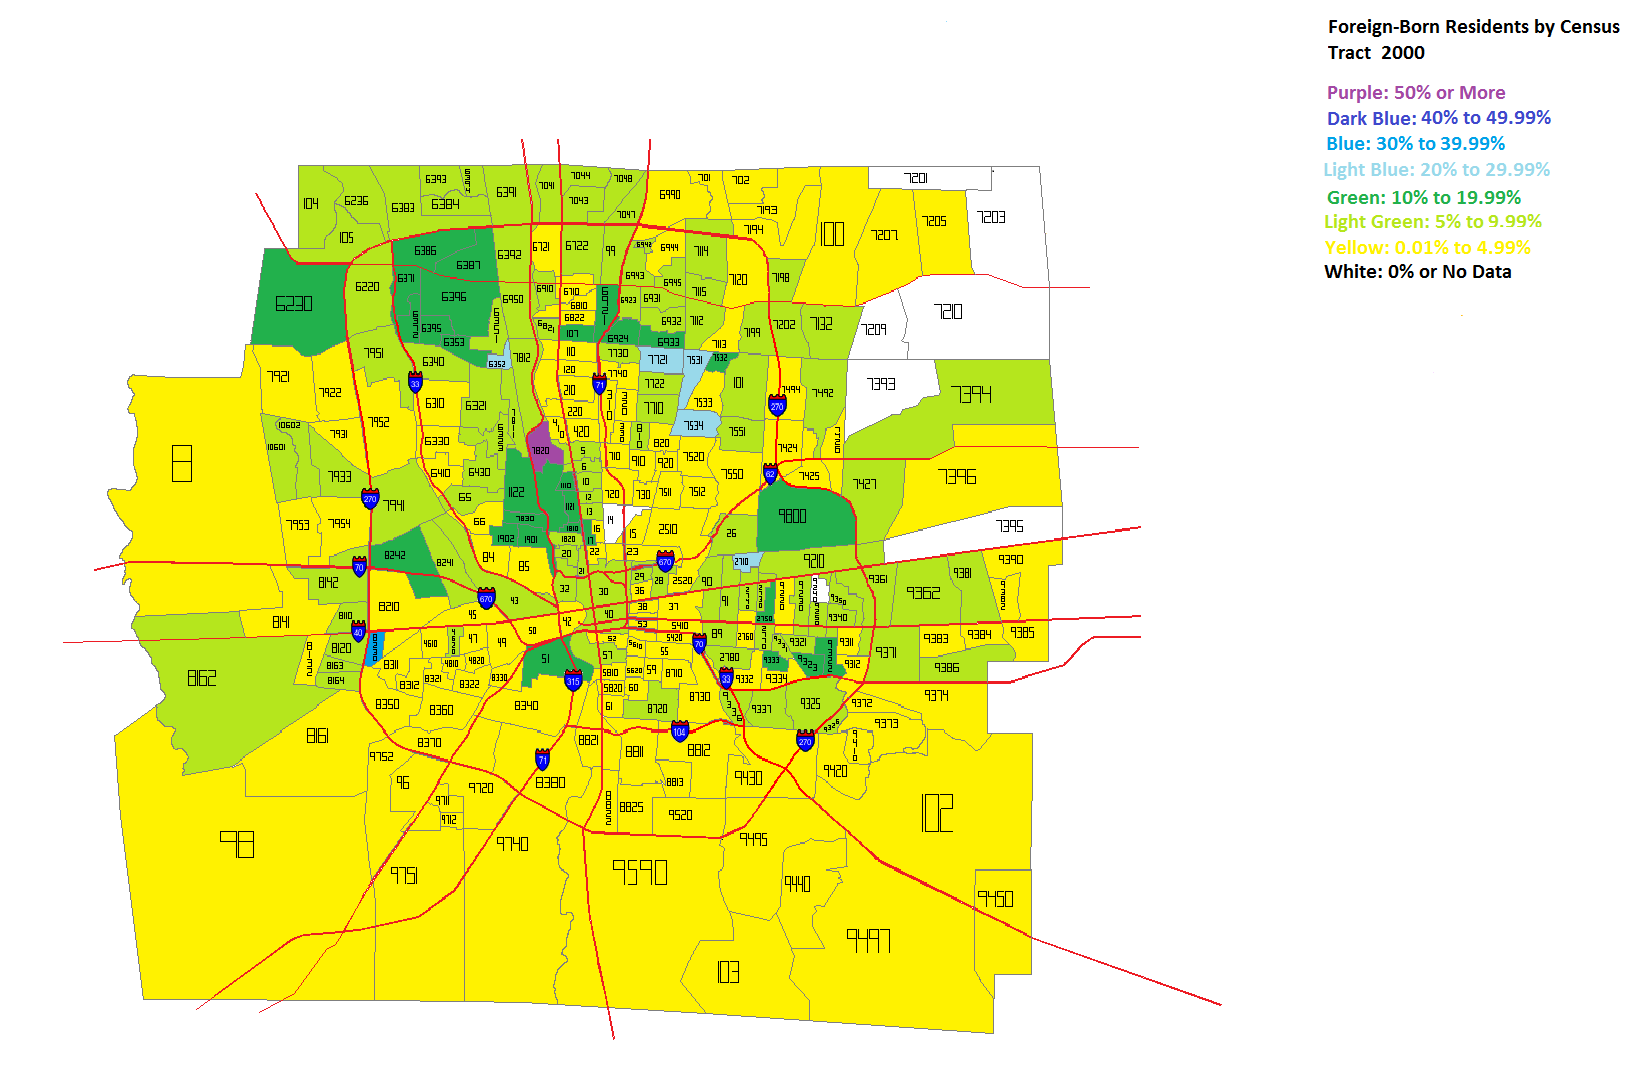
Foreign-Born
New Foreign-Born maps include total foreign-born residents by census tract, as well as a breakdown of their place of birth by region.
2020 Foreign-Born Place of Birth
2020 Foreign Born % of Total Population
2010 Foreign Born % of Total Population
2000 Foreign Born % of Total Population
2010-2020 Foreign Born Population Change
**Coming Soon**
2000-2010 Foreign Born Population Change
**Coming Soon**
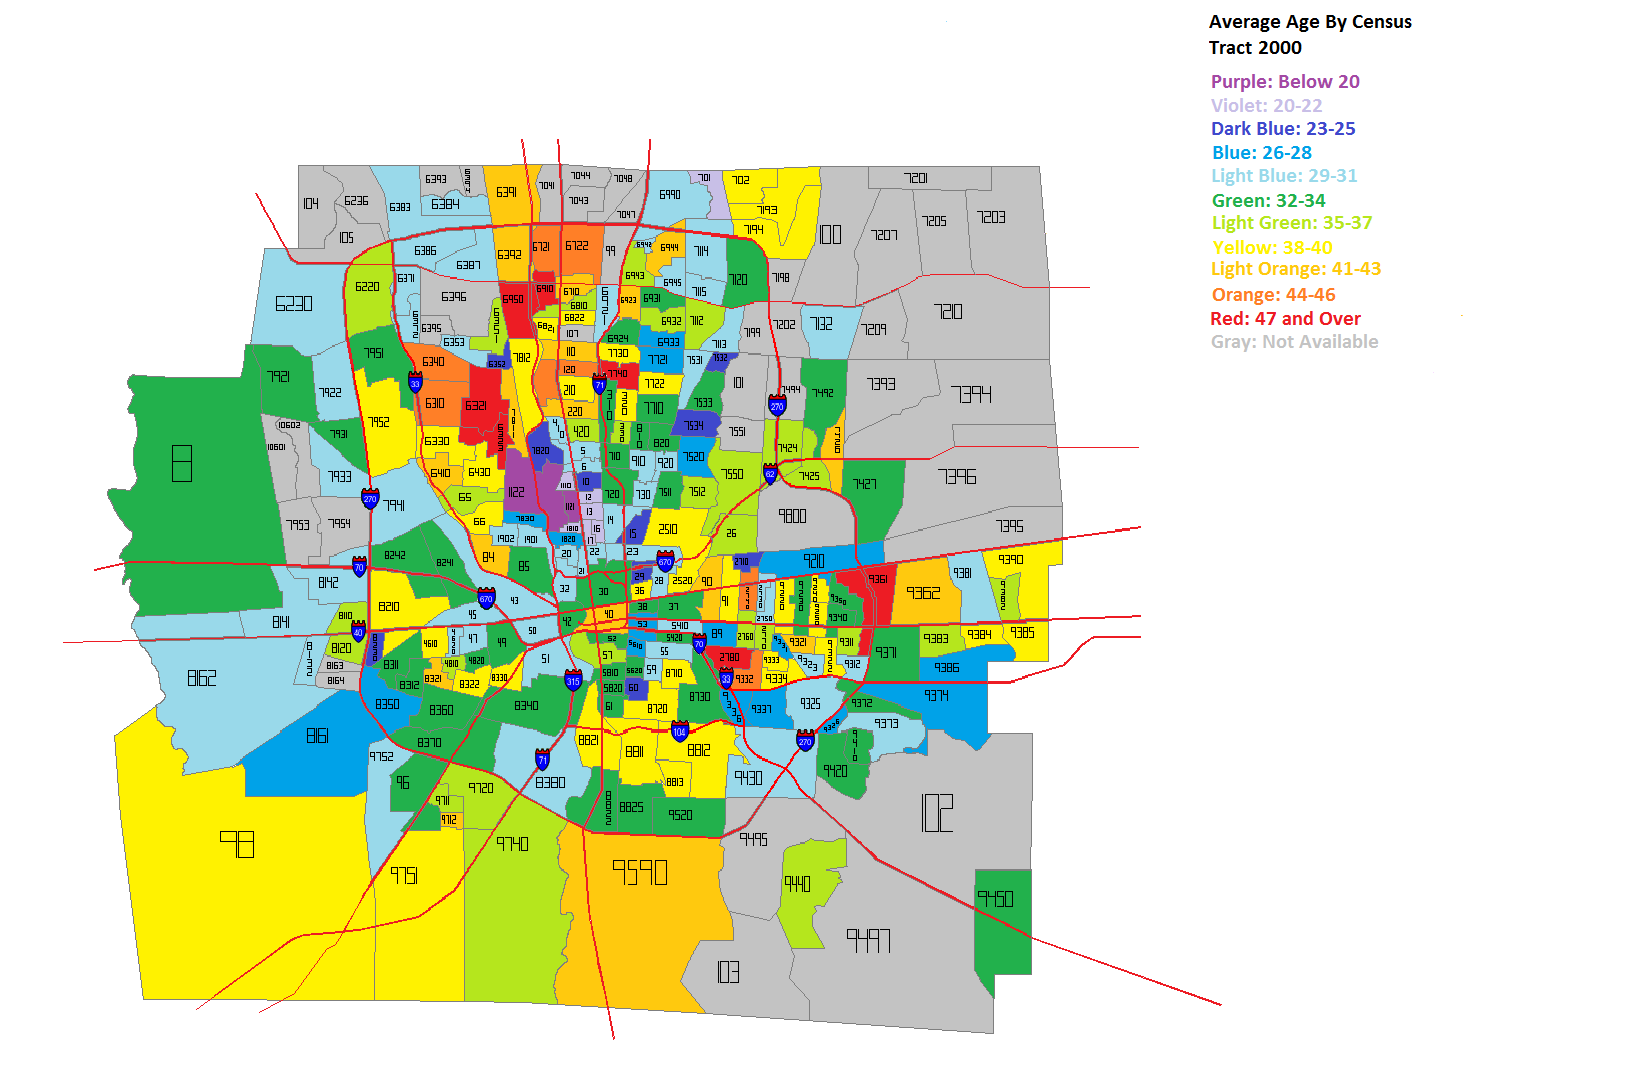
Age
2020 Median Age
2010 Median Age
2000 Median Population Age
Other Statistics
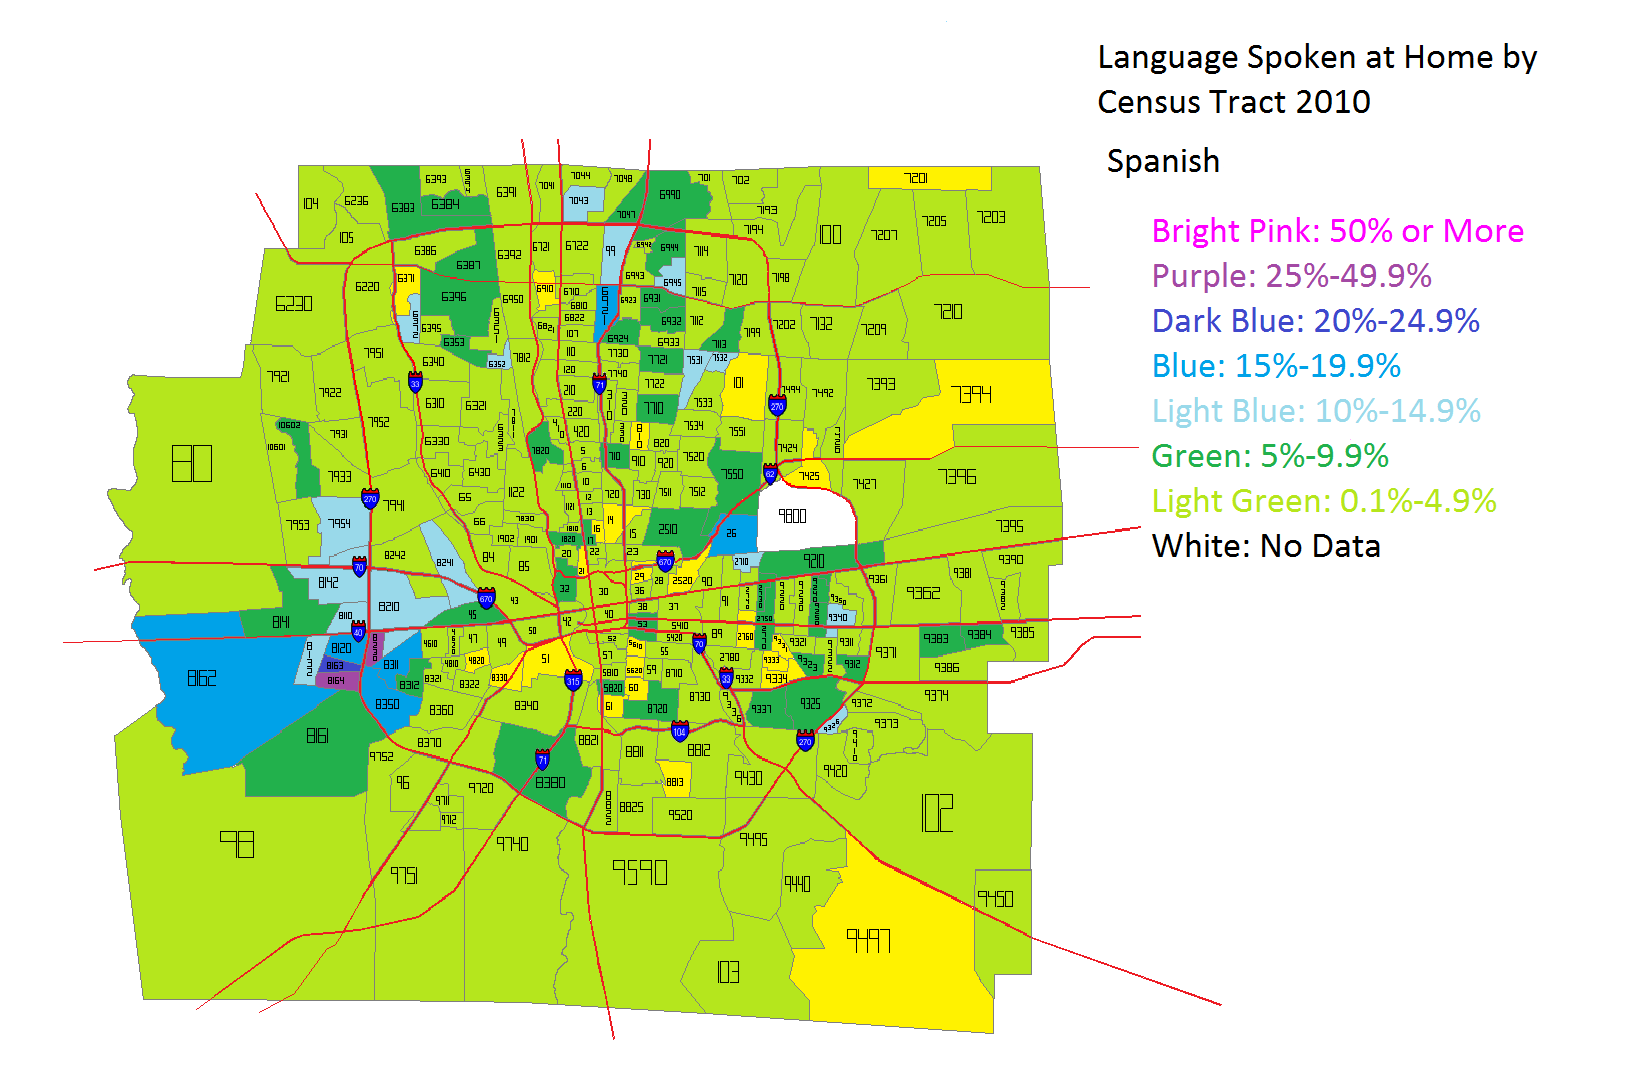
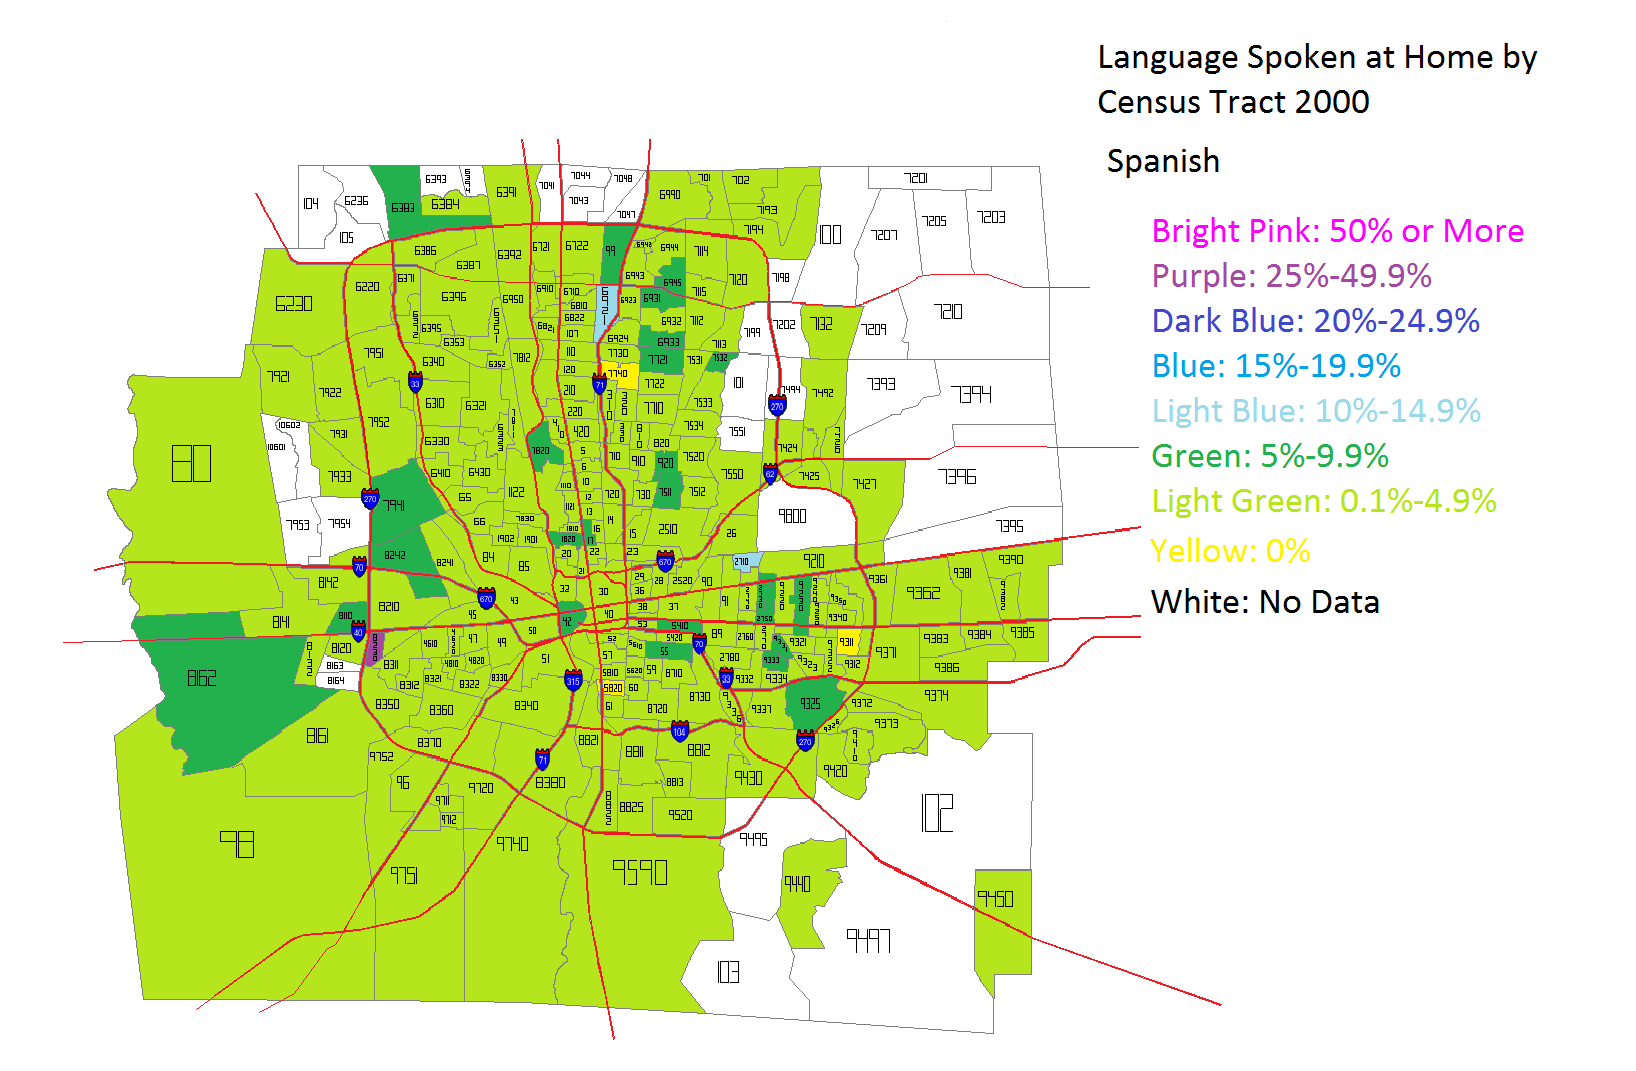
Language
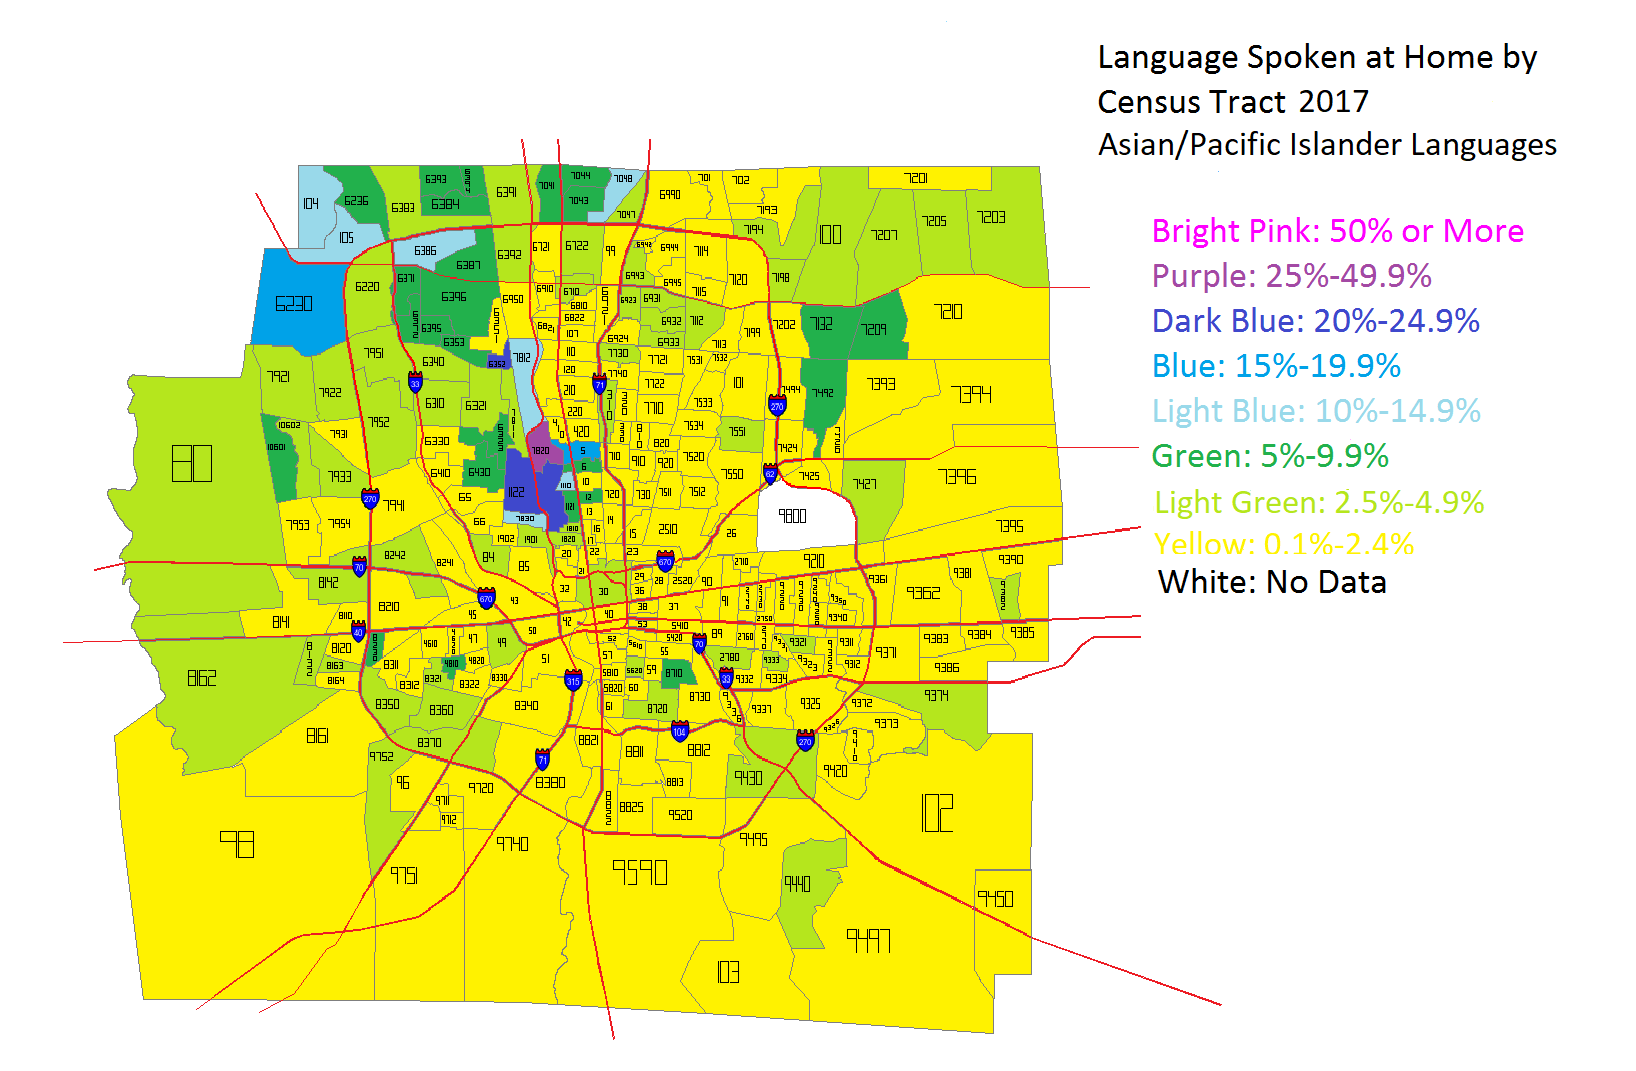
New Language maps break down the % of population and type of non-English languages spoken at home in census tracts.
2019 Language Spoken at Home
2010 Language Spoken at Home
2010 % of Population Speaking Spanish at Home
2000 % of Population Speaking Spanish at Home
2017 % of Population Speaking an Asian or Pacific Islander Language at Home
Education
2020 Bachelor’s Degree or Higher
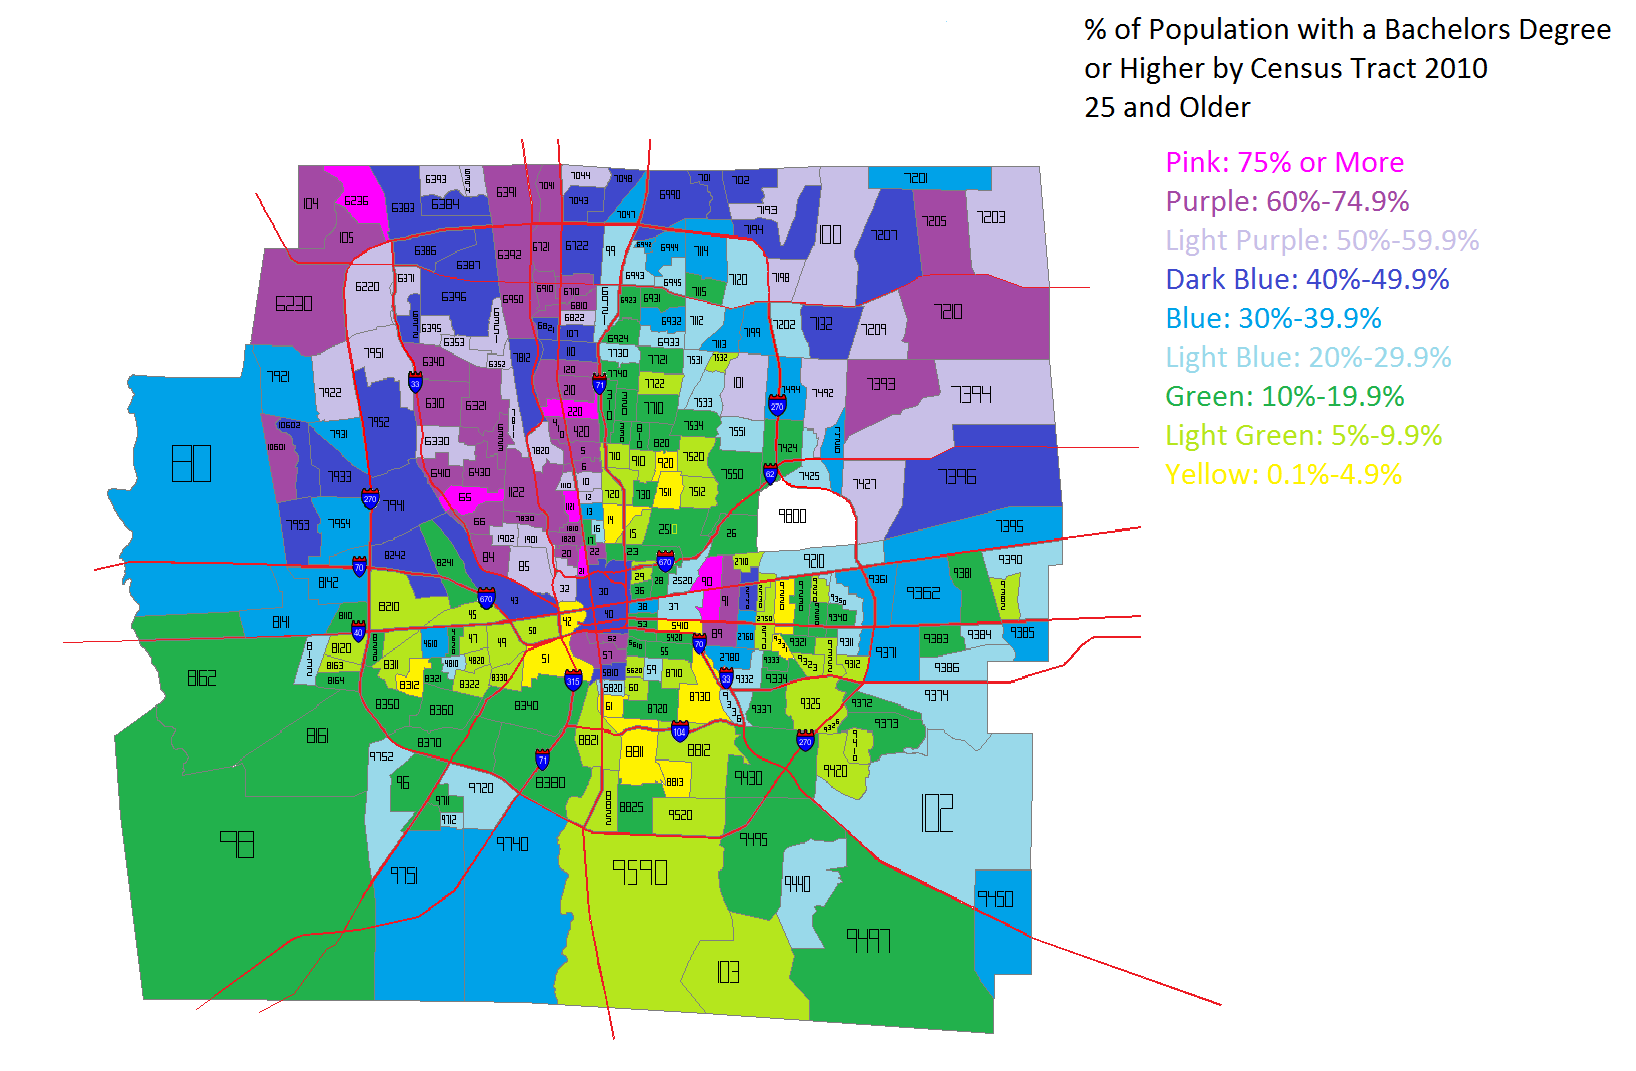
2010 Bachelor’s Degree or Higher
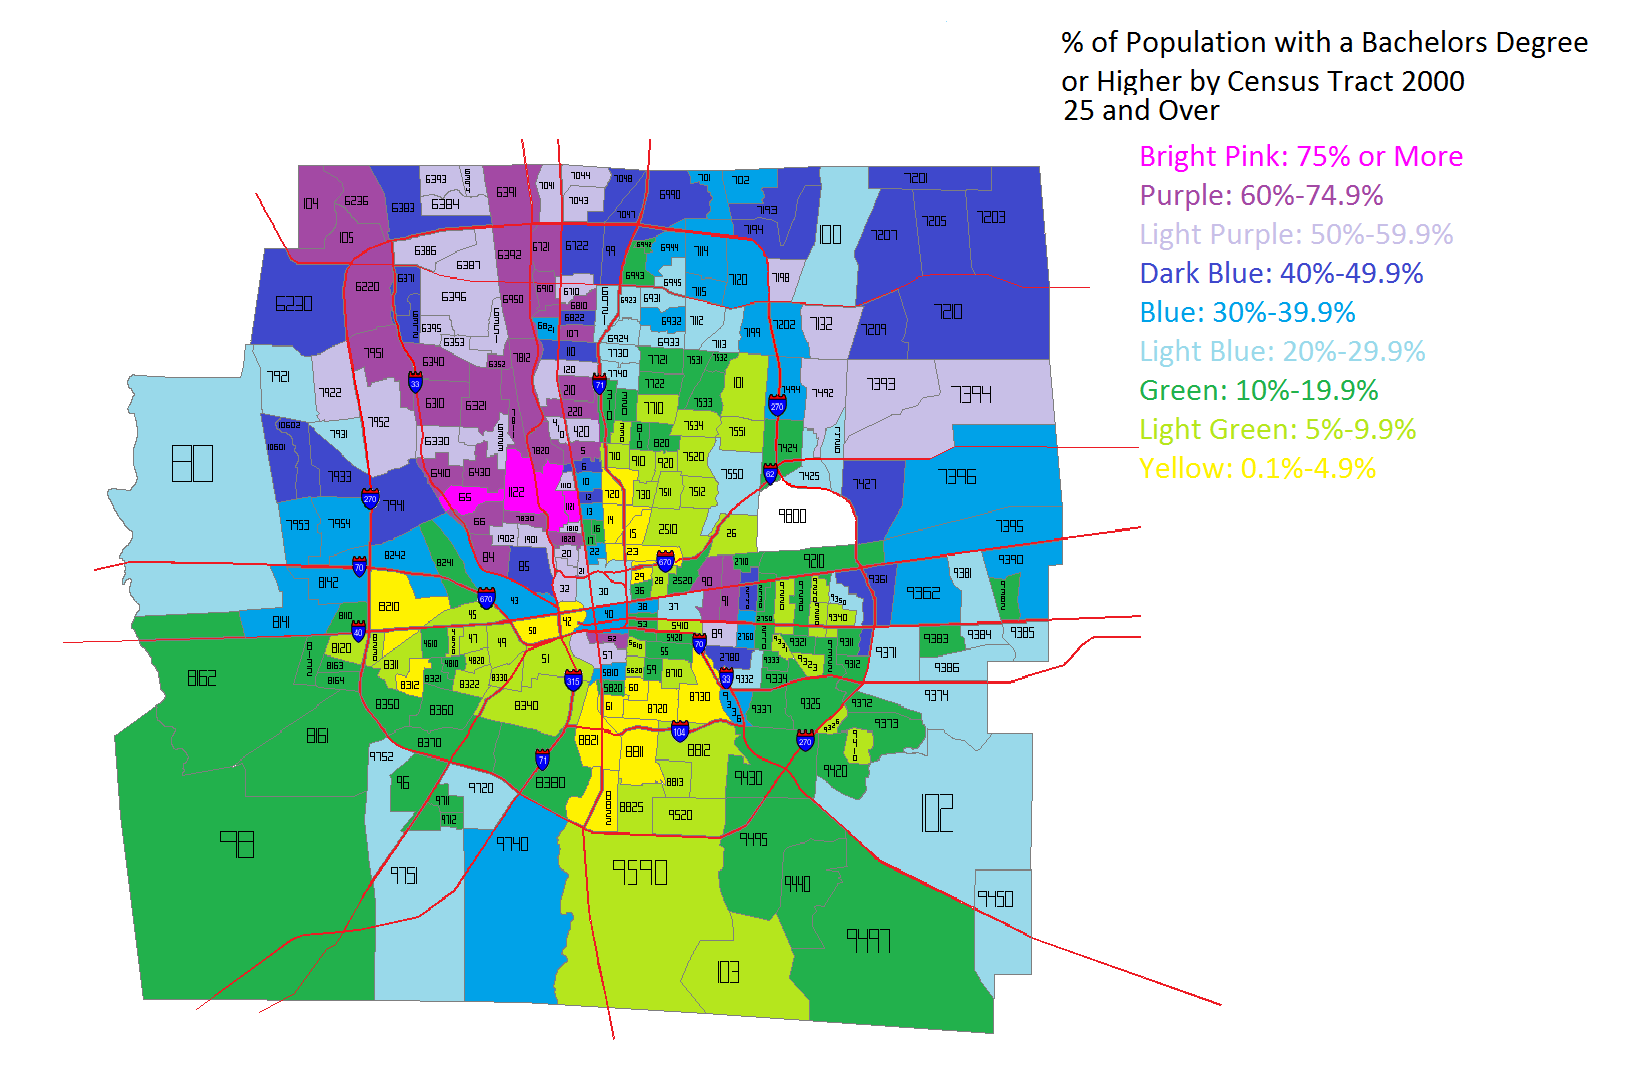
2000 Bachelor’s Degree or Higher
2010-2017 Bachelor’s Degree or Higher Change
**Coming Soon*
2000-2010 Bachelor’s Degree or Higher Change
**Coming Soon**
Income
2020 Median Household Income
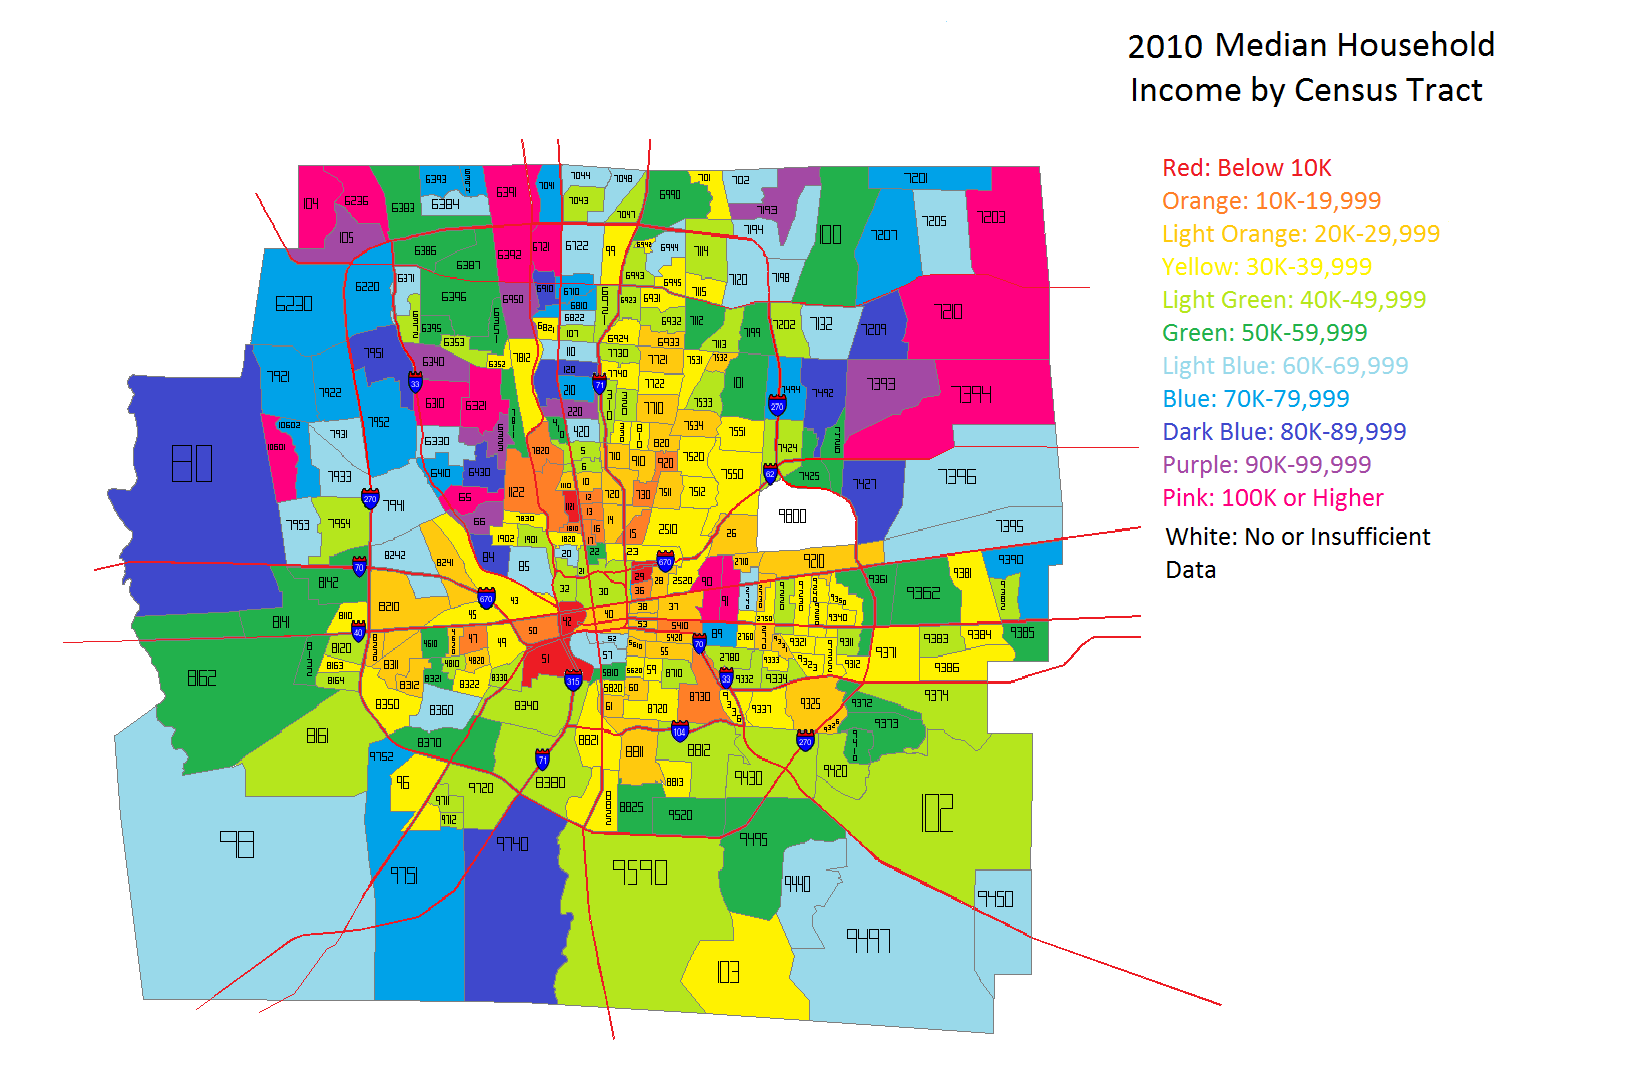
2010 Median Household Income
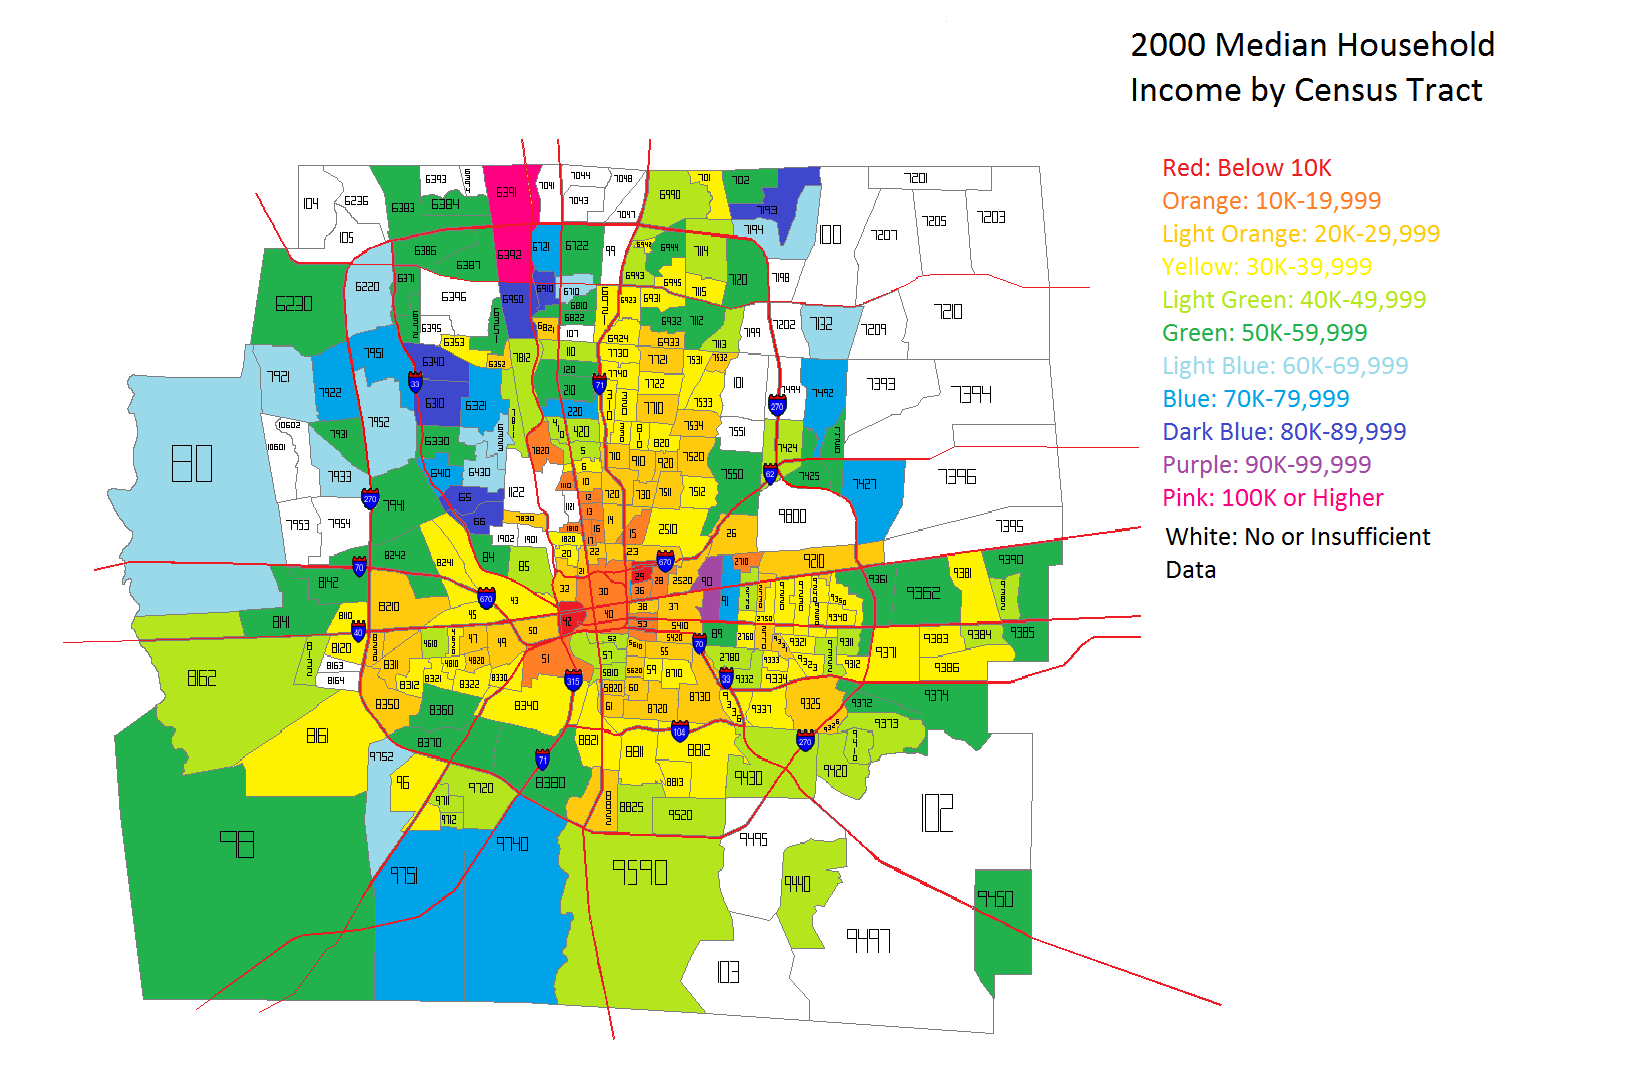
2000 Median Household Income
2010-2020 Median Household Income Change
2000-2010 Median Household Income Change
**Coming Soon**
Median Income by Job Type
2018 Median Income
2020 % of Population in Poverty
2010 % of Population in Poverty

2010-2017 Poverty Change
**Coming Soon**
Housing
New Housing maps include information on the median home value, total units, occupancy rates, home ownership rates and more.
2018 Housing Data
2020 Median Home Value
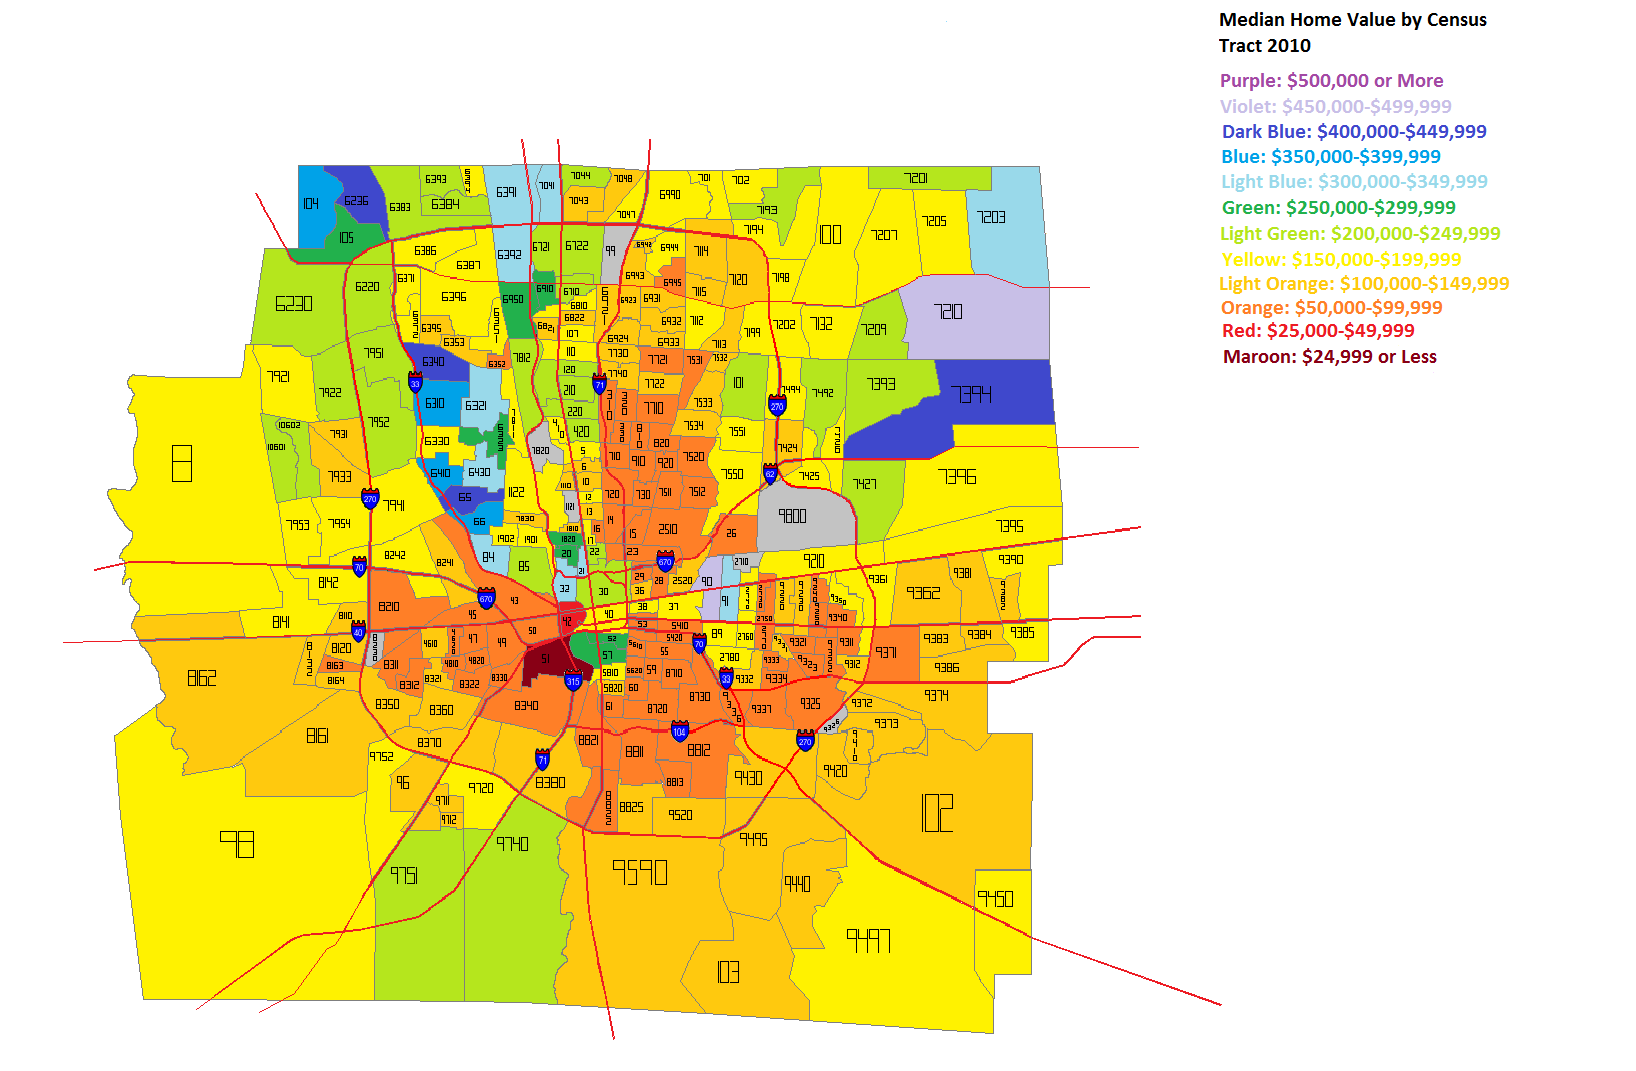
2010 Median Home Value
2010-2017 Median Home Value Change
**Coming Soon**
2010 Housing Vacancy
2010-2019 Housing Vacancy Change
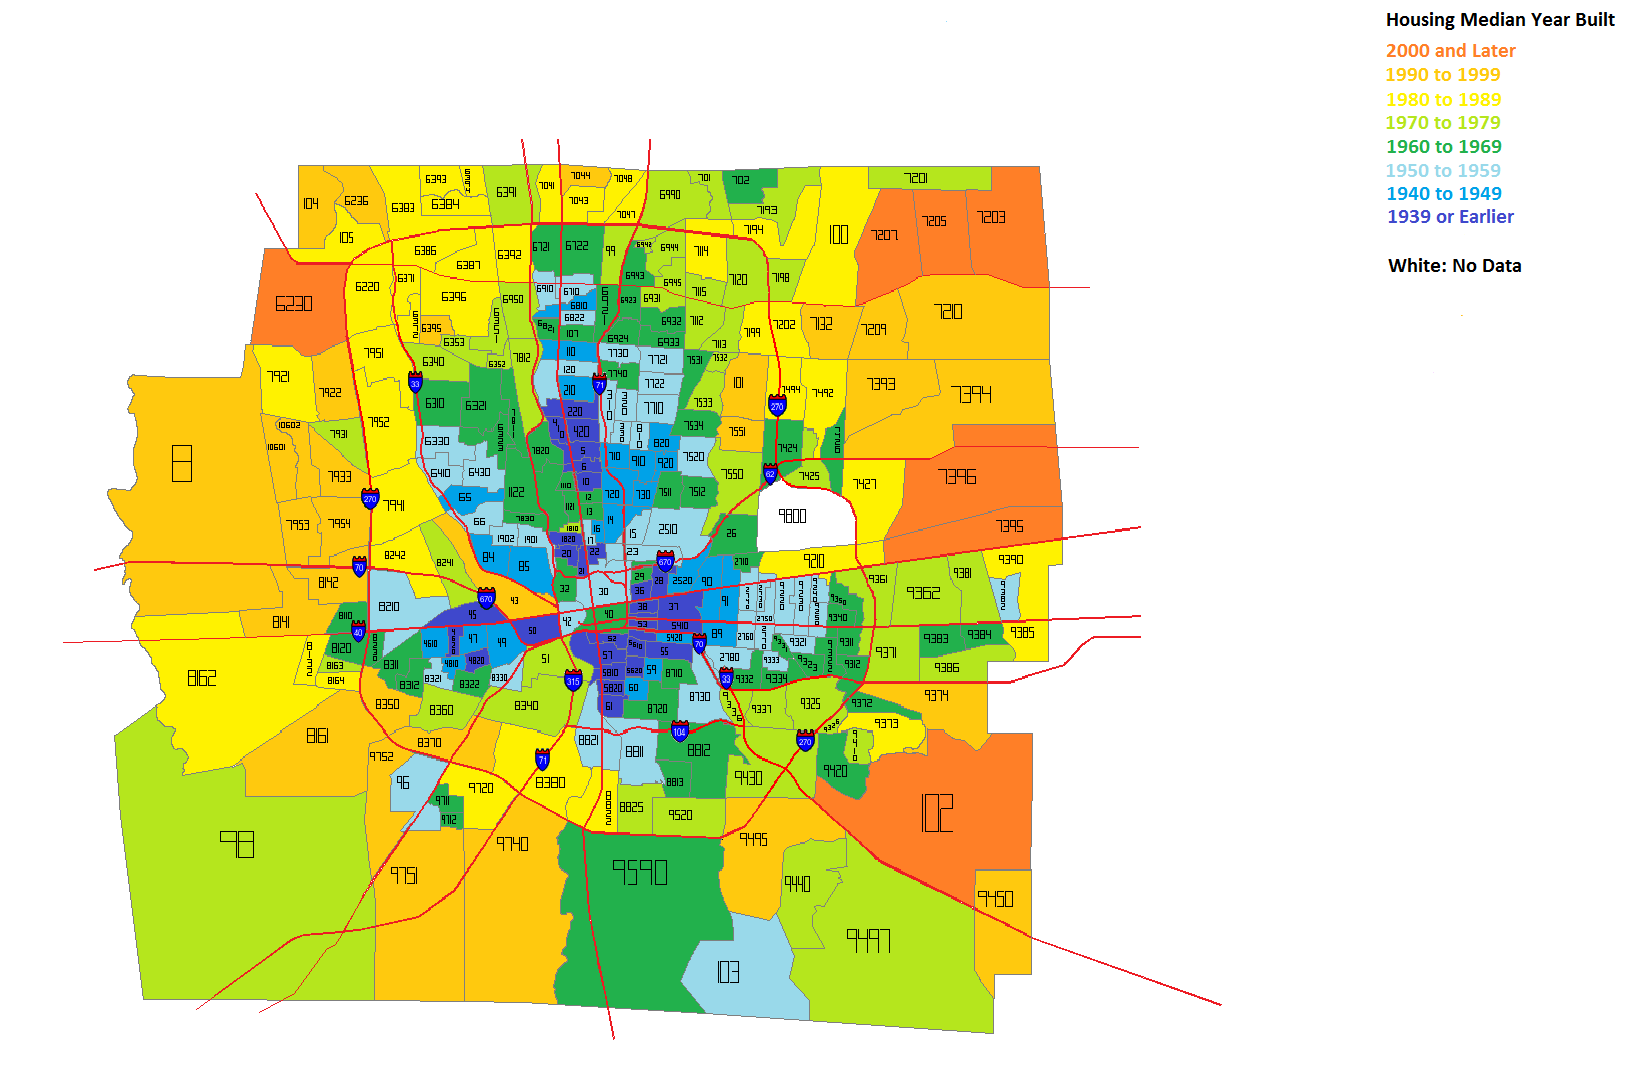
2010 Building Median Year Built
2020 Total Housing Units
2010 Total Housing Units
2010-2020 Total Housing Unit Change
**Coming Soon**
2017 Multi-Family Units % of Total Housing Units
**Coming Soon**
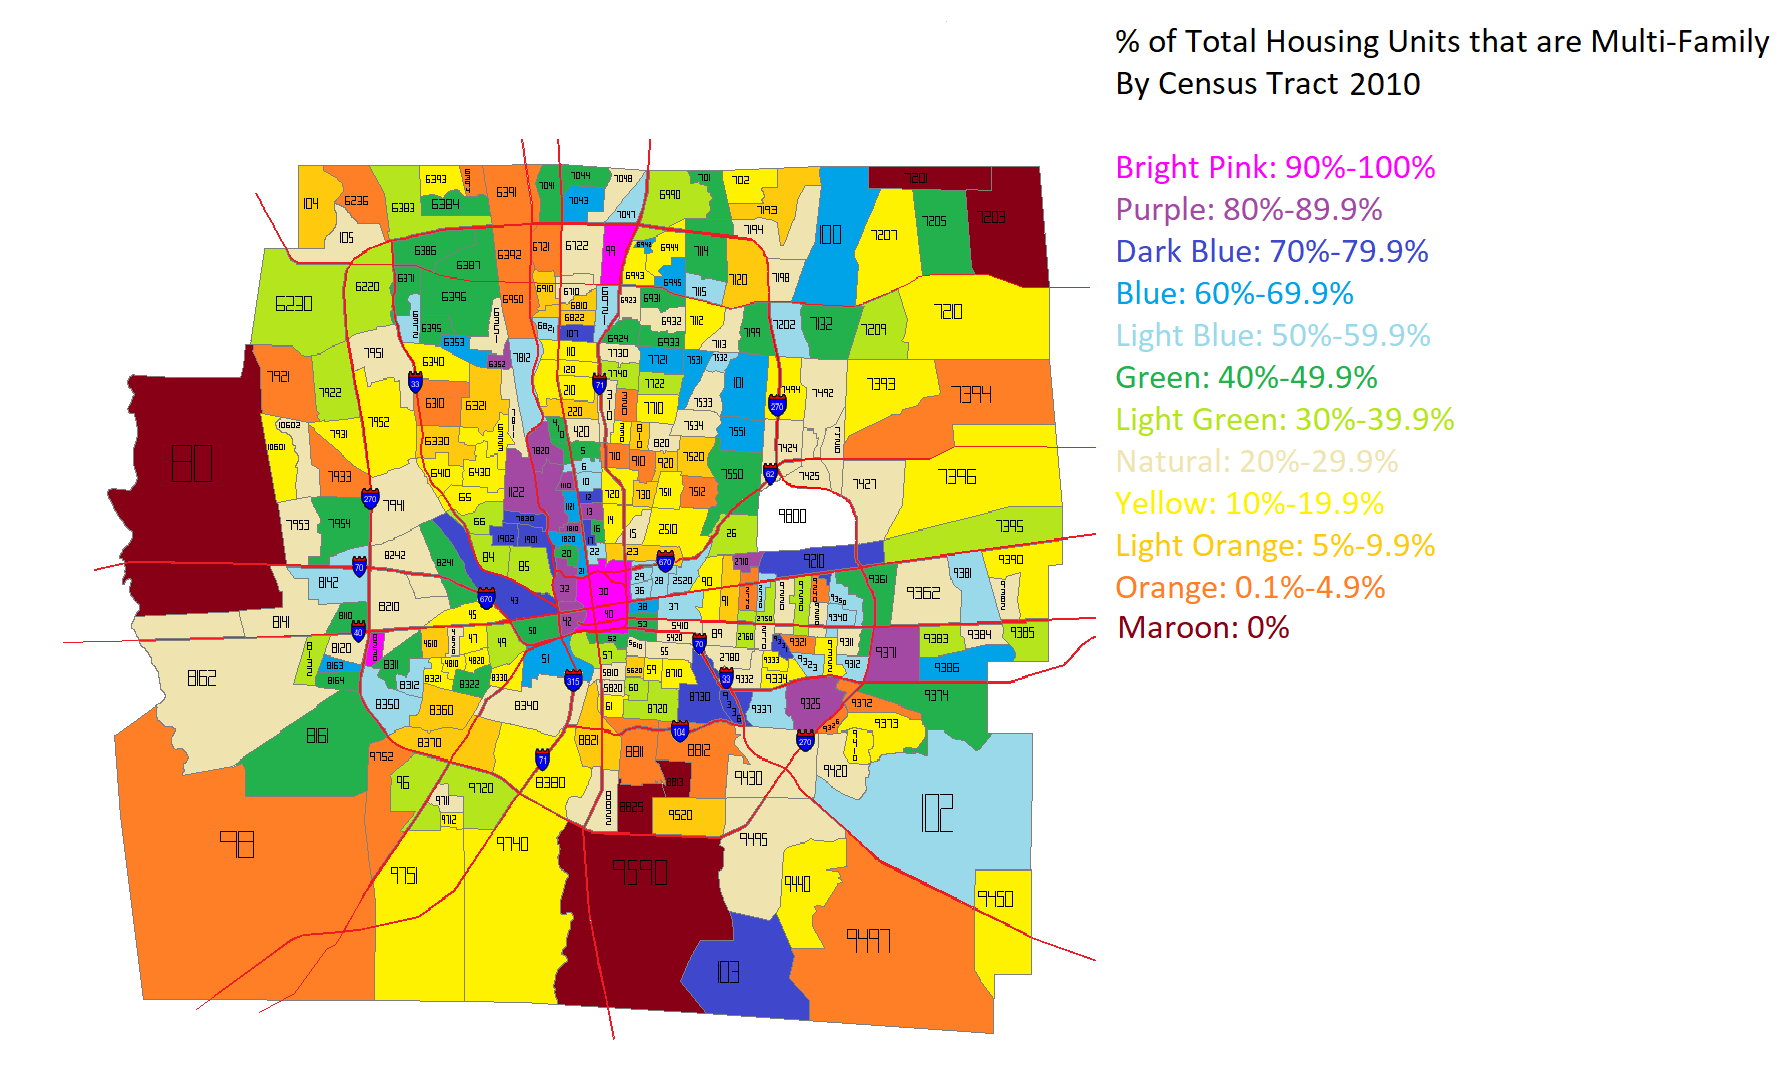
2010 Multi-Family Units % of Total Housing Units
2010-2017 Multi-Family Unit Change
**Coming Soon**
Commuting
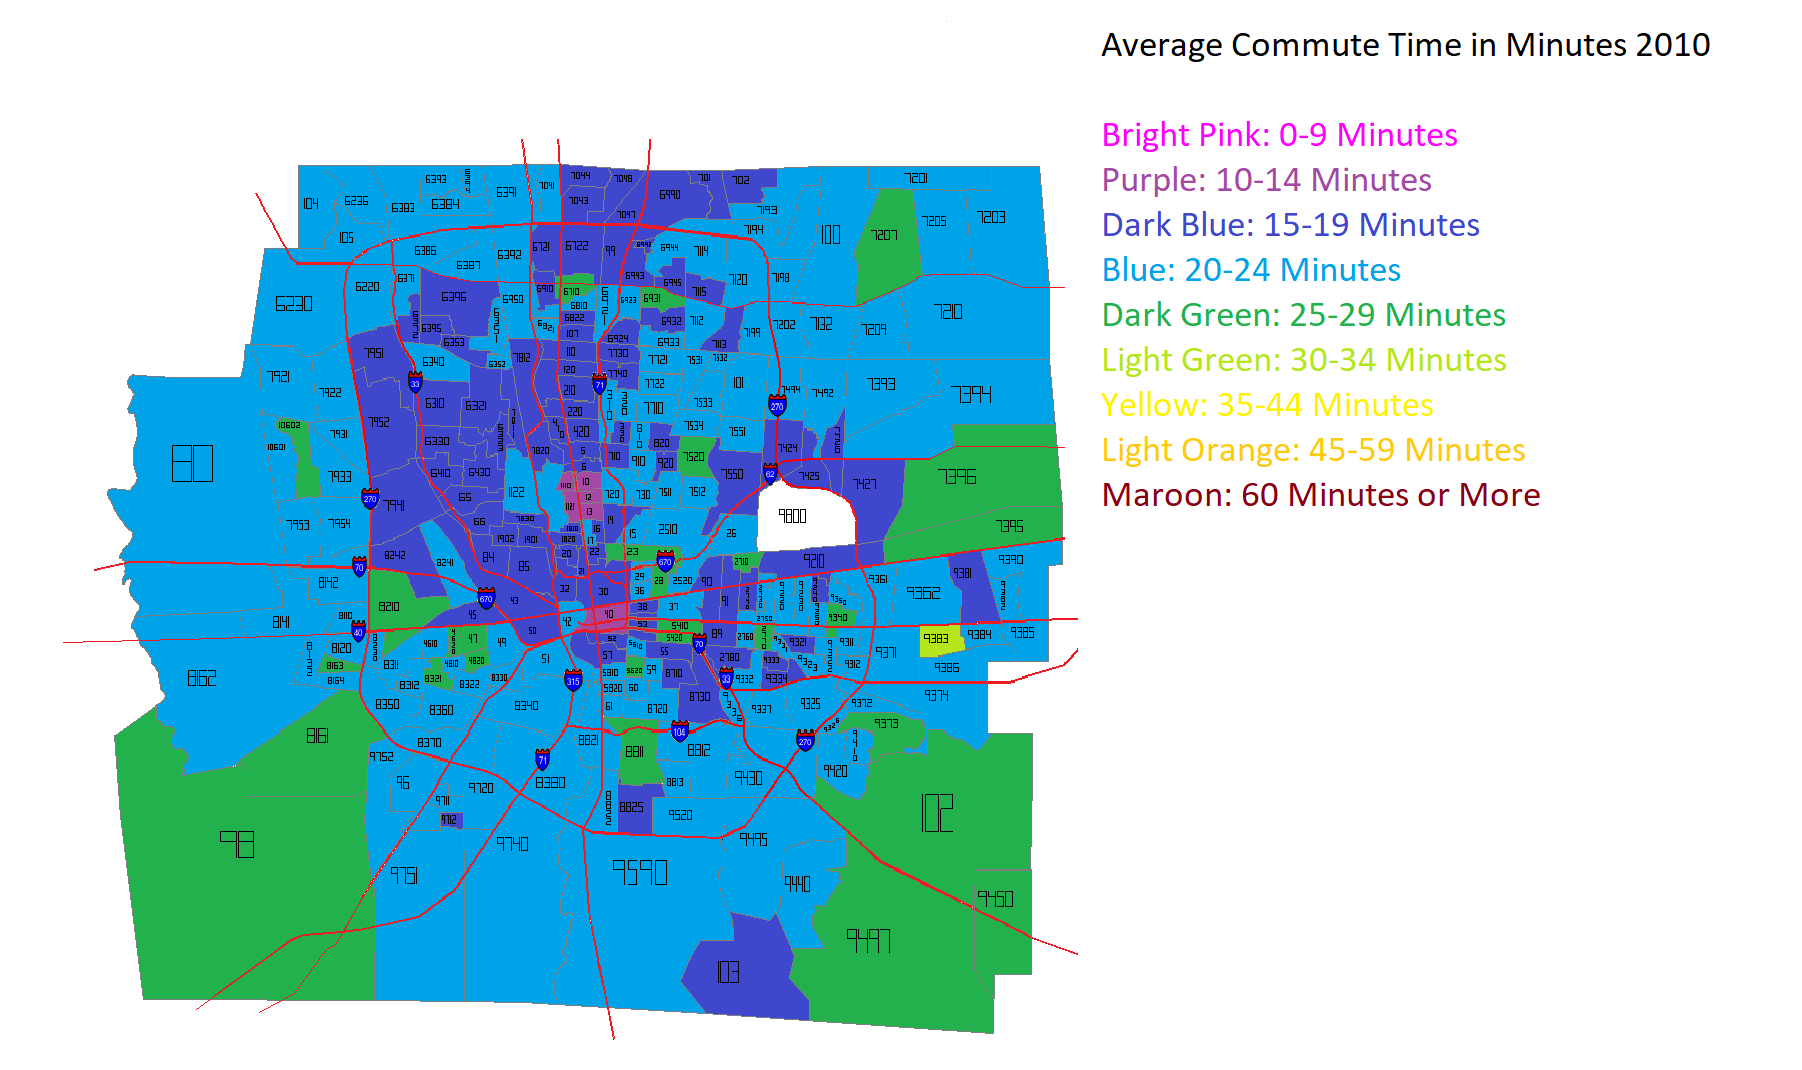
New Commuting Time maps break down census tract population by average commute times in minutes.
2020 Commuting Time in Minutes
2010 Average Commute Time
Commuting Method
This map type is brand new for the site. It breaks down how a census tract’s population gets to work, whether via car, public transit, bike or some other way
2020 Commuters Who Drive Alone
2020 Commuters Using Public Transit
2020 Commuters Who Work from Home
The Demographics and Population pages provides a deeper look at local population data.