1950s Ohio Severe Weather Reports Map


Interested in knowing where severe weather took place in Ohio during the 1950s? Here is a map for all the listed reports during that era. Click on the pins for more information.

https://drive.google.com/open?id=1rAbADeNyKlqLT_7qvxUpURKXlHA&usp=sharing

The map incudes information for tornadoes, high wind and hail reports.

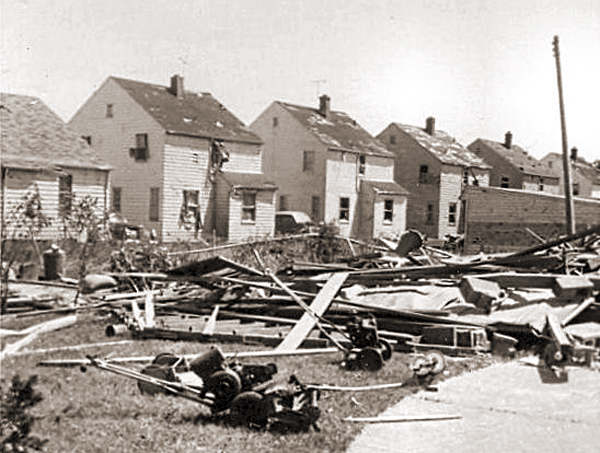
June 8, 1953 Northeast Ohio tornado damage.

Cool Link Mapping Commuting Patterns


A link mapping commuting patterns can be very beneficial if you are curious to know how people get to work in every county in the United States. Luckily, this link does just that.
http://flowingdata.com/2015/01/20/how-americans-get-to-work/

The map was constructed using 2013 data, so it’s fairly recent. As for Franklin County? Here’s the breakdown:
Drive Alone: 82%
Carpool: 8%
Public Transit: 2%
Walk: 2%
Bicycle: 1%
Taxi or Other: 1%
Work from Home: 4%

The numbers are overwhelmingly auto-centric, as they are nearly everywhere, but what the numbers don’t show are any trends.