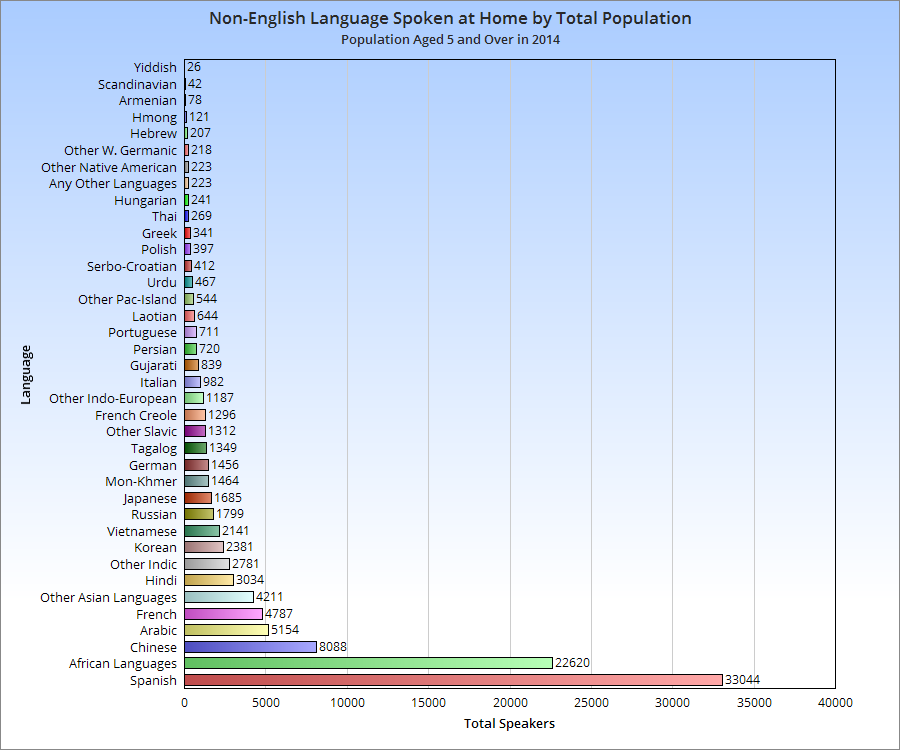
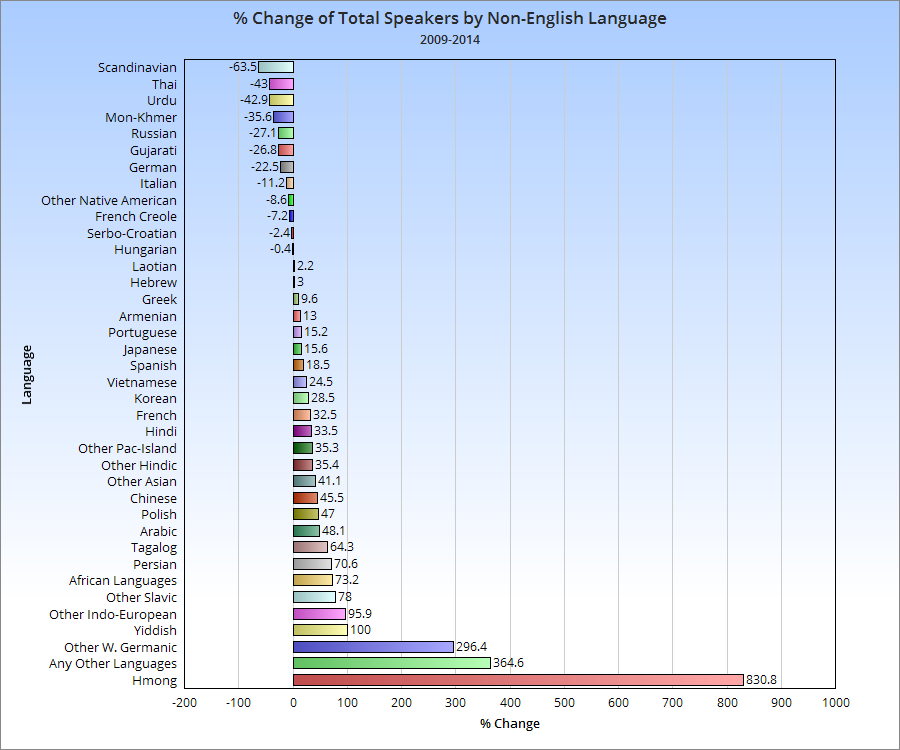
Just a quick little post about the non-English languages spoken in the city of Columbus and how they have changed between 2009 and 2014, by total number of speakers.
For the record, in 2014, 14.3% of the Columbus population spoke a language other than English at home, up from about 12% in 2009.
I saw this post the other day about changing neighborhood demographics in certain cities, particularly when it comes to racial segregation and gentrification. Surprisingly, of all the maps and posts I’ve done on demographics, I hadn’t thought to do one like this. Well, now I have, so here are Franklin County’s gentrification trends 1990-2014. A bit of an explanation is needed for the color coding: -For those categories marked “Steady”, the demographic listed has been the majority throughout the period, with little to no change of other demographics. -For those mixed categories of one decline and one rise, it means that the majority demographic has declined at least 5%, while a secondary demographic has risen at least 5%. -For the category of recent or steady integration, there are at least 2 demographics at 10% or more of the total population, as well as a 3rd demographic reaching at least 5% of the population.
A few things that stand out to me is that the Steady White population dominates at least 50% of the map, while there are very few areas with Steady Black population. One would be tempted to suggest that gentrification is forcing the Black population out of neighborhoods, but this doesn’t seem to be true. In terms of significant changes, there are FAR more areas with Black population growth and White population decline than vice-versa, suggesting that “White Flight” may continue to be an issue. Also, a surprising number of areas have reached full integration, or have at least been maintaining it over the period of question. These neighborhoods of demographic equilibrium are largely the result of increasing Hispanic and Asian populations, particularly on the Northeast and West Sides, as well as the Whitehall area. In the center core, almost all of the High Street corridor has remained steady White, suggesting that other demographics have, so far, been unable to tap into the building boom along and adjacent to this corridor.
Here are the most integrated tracts by year, based the above criteria. 1990 1. #8720- South Side 2. #7820- Riverview-NW Side 3. #1122- West Campus 4. #1121- Campus 5. #29- King-Lincoln Only 5 tracts counted as being integrated in 1990.