2015 Metro Area Population Estimates and Peer Comparison


As promised, here are the 2015 metro area population estimates for Columbus and its regional and national peers.

2015 Metro Population Estimates
Chicago, IL: 9,551,031
Detroit, MI: 4,302,043
Minneapolis, MN: 3,524,583
St. Louis, MO: 2,811,588
Charlotte, NC: 2,426,363
Portland, OR: 2,389,228
Orlando, FL: 2,387,138
San Antonio, TX: 2,384,075
Pittsburgh, PA: 2,353,045
Sacramento, CA: 2,274,194
Cincinnati: 2,157,719
Las Vegas, NV: 2,114,801
Kansas City, MO: 2,087,471
Cleveland: 2,060,810
Columbus: 2,021,632
Austin, TX: 2,000,860
Indianapolis: 1,988,817
San Jose, CA: 1,976,836
Nashville, TN: 1,830,345
Virginia Beach, VA: 1,724,876
Providence, RI: 1,613,070
Milwaukee, WI: 1,575,747
Grand Rapids, MI: 1,038,583
Omaha, NE: 915,312
Dayton: 800,909
Akron: 704,243
Toledo: 605,956
Youngstown: 549,885
2015 metro area population estimates

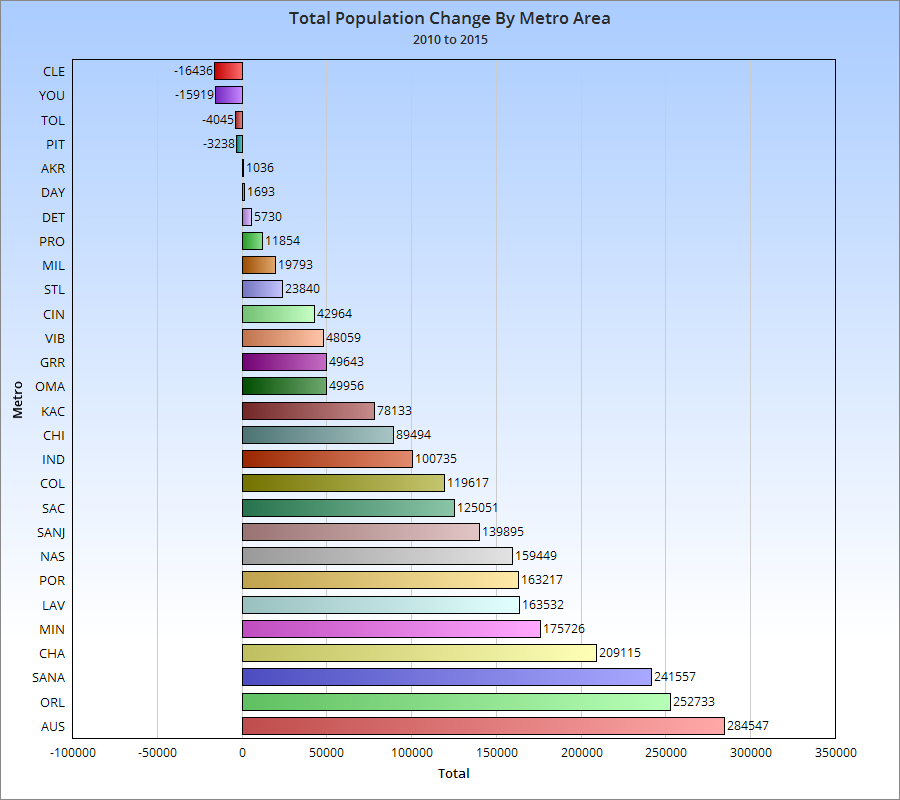
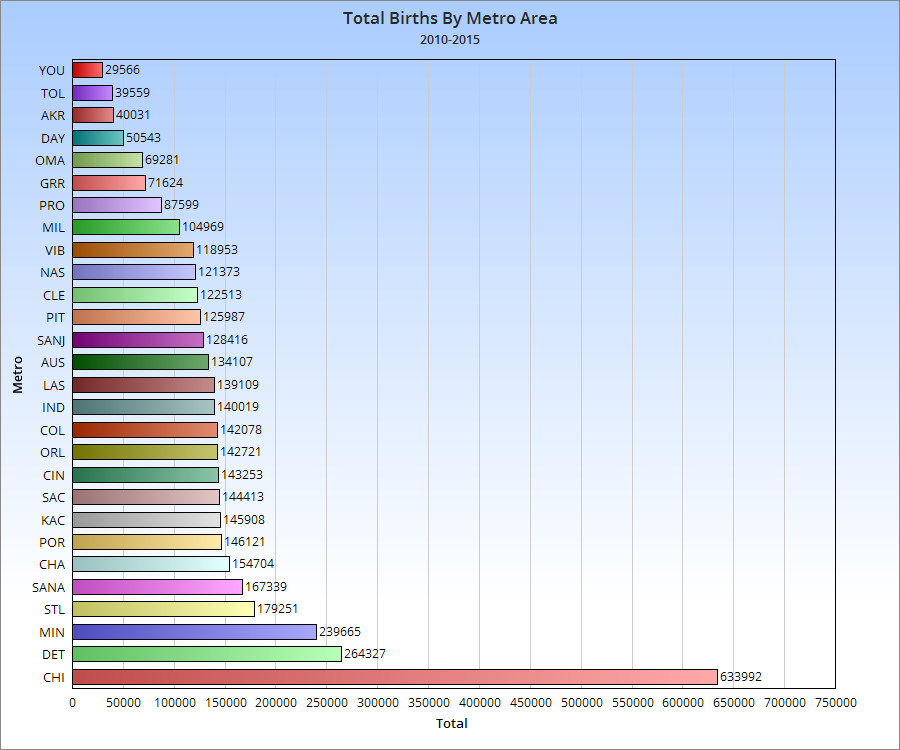
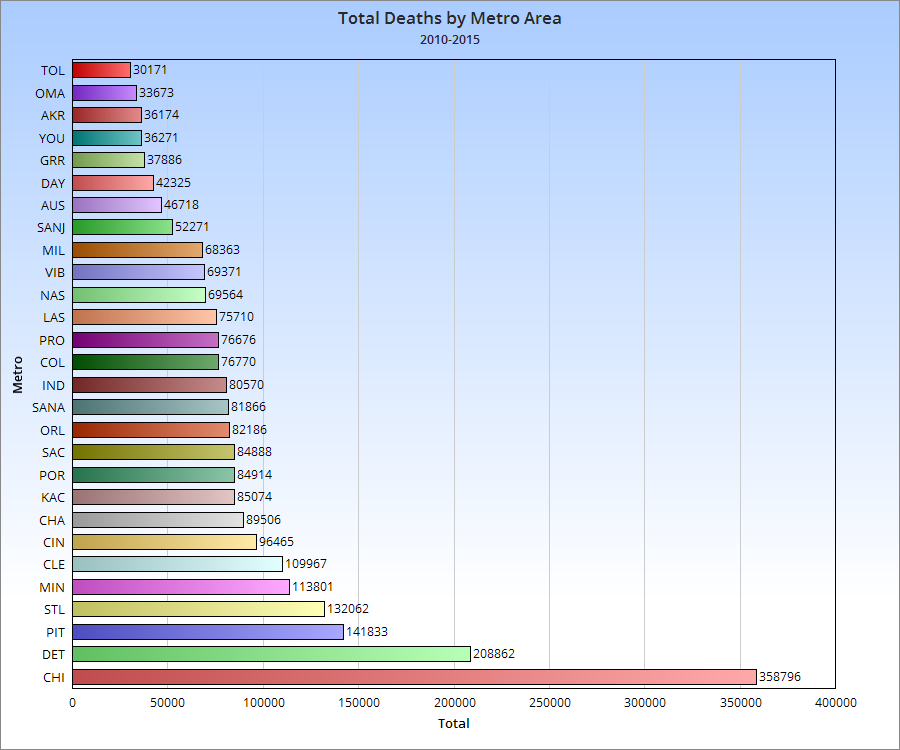
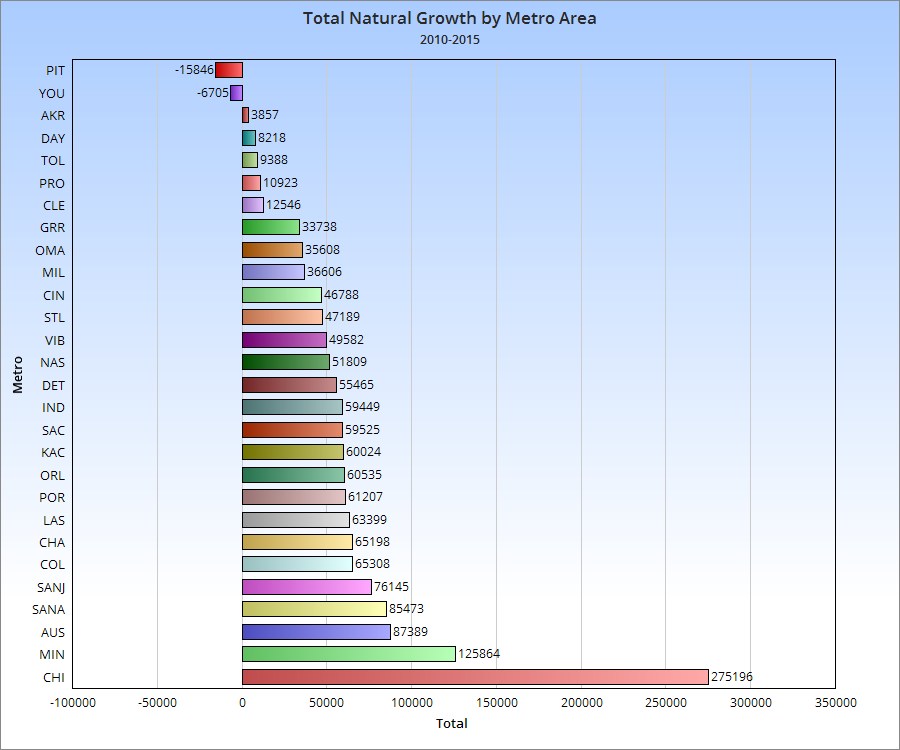
Components of Metro Area Population Change


As you can see, while Columbus has a middle of the road birth rate for its peers, its relatively low death rate means that it manages to be near the top of the its peer group in natural growth.


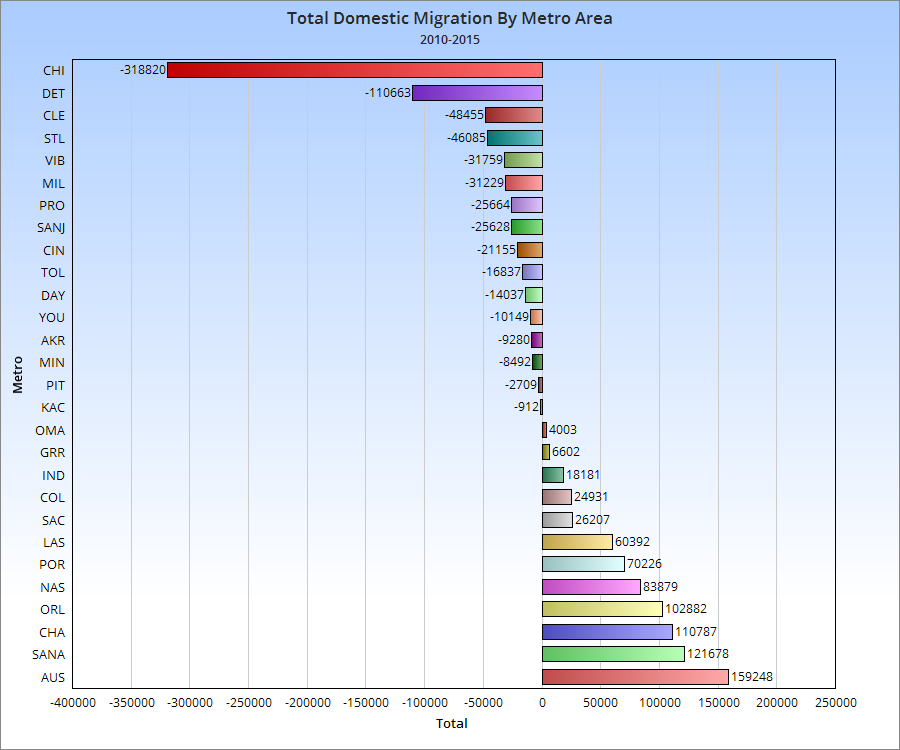
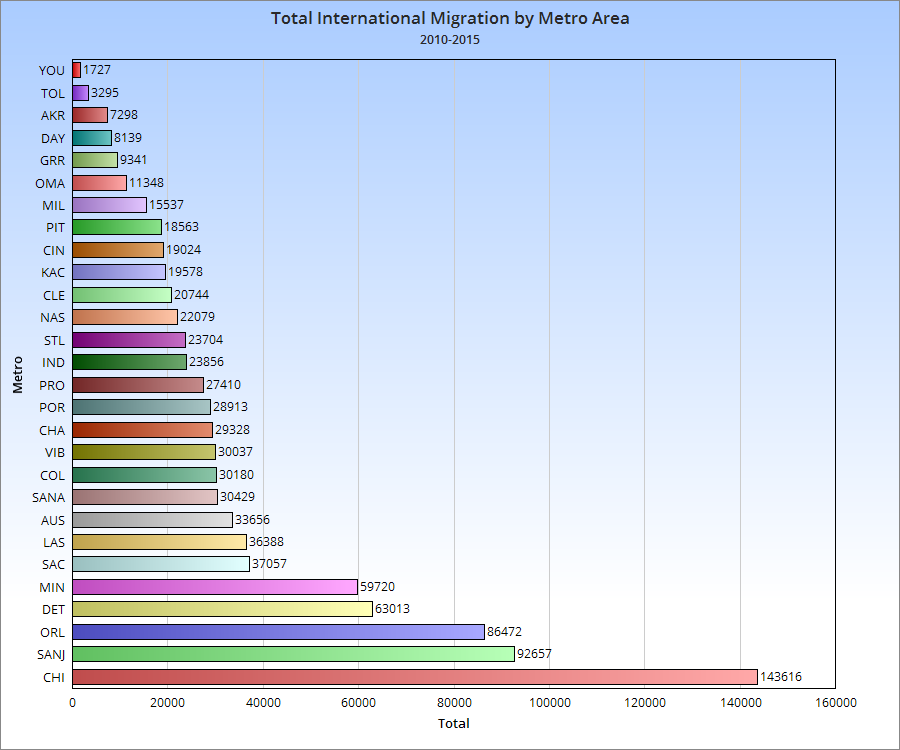
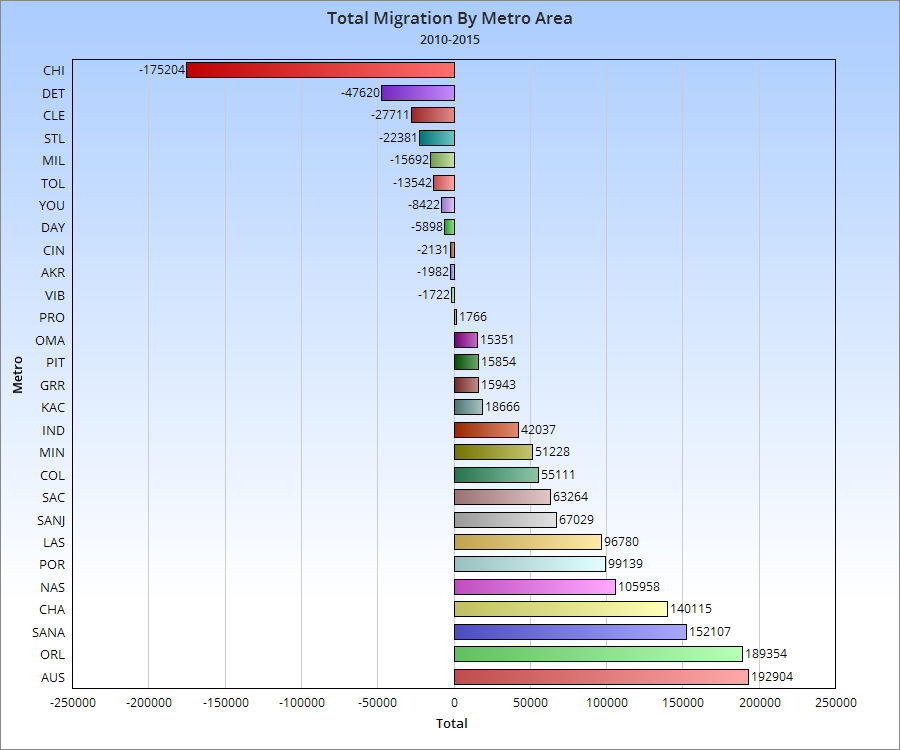
It seems that while international migration is competitive with peers in the Columbus metro, domestic migration would need to improve to truly be at the upper peer level. At the very least, it is positive.

For more local and national population and demographic data, visit:
Demographics and Population
US Census


2015 County Population Estimates Report


The US Census has released its population estimates for both counties and metros for the year ending July 1, 2015. Here is a detailed look at Ohio’s counties in this 2015 county population estimates report.

Ohio’s Top 25 Largest Counties
2010……………………………….2014………………………………..2015

1. Cuyahoga: 1,280,109….1. Cuyahoga: 1,263,796……1. Cuyahoga: 1,255,921
2. Franklin: 1,163,545……..2. Franklin: 1,234,126………2. Franklin: 1,251,722
3. Hamilton: 802,270……….3. Hamilton: 806,332……….3. Hamilton: 807,598
4. Summit: 541,671………..4. Summit: 542,600………….4. Summit: 541,968
5. Montgomery: 536,216….5. Montgomery: 532,515…..5. Montgomery: 532,258
6. Lucas: 441,575…………..6. Lucas: 434,615…………….6. Lucas: 433,689
7. Stark: 375,461…………….7. Stark: 375,638…………….7. Butler: 376,353
8. Butler: 369,064…………..8. Butler: 373,948…………….8. Stark: 375,165
9. Lorain: 301,471…………..9. Lorain: 304,187……………9. Lorain:305,147
10. Mahoning: 238,398……10. Mahoning: 233,398…….10. Mahoning: 231,900
11. Lake: 230,004…………..11. Lake: 229,220……………11. Lake: 229,245
12. Warren: 213,524………..12. Warren: 221,816………..12. Warren: 224,469
13. Trumbull: 209,854………13. Trumbull: 205,255……..13. Trumbull: 203,751
14. Clermont: 197,795……..14. Clermont: 201,375……..14. Clermont: 201,973
15. Delaware: 175,146……..15. Delaware: 189,237…….15. Delaware: 193,0134
16. Medina: 172,542………..16. Medina: 175,963………..16. Medina: 176,395
17. Licking: 166,480…………17. Licking: 169,407………..17. Licking: 170,570
18. Greene: 161,608………..18. Greene: 164,660………..18. Greene: 164,427
19. Portage: 161,448……….19. Portage: 162,235………..19. Porage: 162,275
20. Fairfield: 146,385……….20. Fairfield: 150,432………..20. Fairfield: 151,408
21. Clark: 148,246…………..21. Clark: 136,482……………21. Clark: 135,959
22. Wood: 125,940………….22. Wood: 129,575…………..22. Wood: 129,730
23. Richland: 124,173……..23. Richland: 121,914……….23. Richland: 121,707
24. Wayne: 114,439………..24. Wayne: 115,572………….24. Wayne: 116,063
25. Columbiana: 107,863…25. Columbiana: 105,597…..25. Columbiana: 104,806

From the numbers above, Columbus’ Franklin County was just below Cuyahoga last year. It is likely that, given each county’s growth rates, Franklin has now passed up Cuyahoga to become Ohio’s most populated county.

Top 25 Total Growth Counties 2010-2015
1. Franklin: +88,177
2. Delaware: +18,824
3. Warren: +11,601
4. Butler: +8,223
5. Fairfield: +5,256
6. Hamilton: +5,224
7. Clermont: +4,610
8. Wood: +4,242
9. Licking: +4,090
10. Medina: +4,062
11. Lorain: +3,791
12. Greene: +2,858
13. Union: +2,010
14. Miami: +1,718
15. Wayne: +1,549
16. Holmes: +1,543
17. Pickaway: +1,300
18. Athens: +1,113
19. Portage: +854
20. Hancock: +791
21. Geauga: +692
22. Madison: +664
23. Tuscarawas: +334
24. Morrow: +247
25. Muskingum: +216
2015 county population estimates report

Components of County Population Change

Top 25 Counties for Natural Growth (Births vs. Deaths) 2010-2015
1. Franklin: +50,736
2. Hamilton: +17,256
3. Butler: +7,785
4. Cuyahoga: +7,409
5. Lucas: +7,053
6. Delaware: +6,260
7. Montgomery: +5,007
8. Warren: +4,688
9. Clermont: +3,987
10. Summit: +3,194
11. Fairfield: +2,676
12. Lorain: +2,630
13. Holmes: +2,613
14. Wayne: +2,554
15. Licking: +2,482
16. Greene: +2,309
17. Medina: +2,040
18. Wood: +1,824
19. Union: +1,475
20. Hancock: +1,196
21. Allen: +1,115
22. Shelby: +1,038
23. Miami: +902
24. Putnam: +849
25. Huron: +815

Franklin County’s natural growth rate destroys every other county in the state. It gains almost 7x that of Cuyahoga County, despite Cuyahoga having a larger population during this period, and nearly 3x that of Hamilton County.

Top 25 Counties for Domestic Migration 2010-2015
1. Franklin: +11,715
2. Delaware: +10,532
3. Warren: +4,496
4. Fairfield: +1,691
5. Licking: +1,249
6. Medina: +1,234
7. Wood: +1,120
8. Pickaway: +711
9. Miami: +475
10. Union: +249
11. Madison: +246
12. Ottawa: +5
13. Clermont: -39
14. Morrow: -159
15. Morgan: -162
16. Monroe: -167
17. Washington: -177
18. Harrison: -198
19. Belmont: -221
20. Geauga: -320
21. Vinton: -361
22. Meigs: -401
23. Noble: -421
24. Van Wert: -431
25. Perry: -464

Again, Franklin County leads the pack, with Columbus metro counties performing the best statewide, as shown in the map below.

Top 25 Counties for International Migration 2010-2015
1. Franklin: +26,977
2. Cuyahoga: +16,926
3. Hamilton: +9,016
4. Montgomery: +5,380
5. Summit: +5,307
6. Butler: +4,066
7. Greene: +2,400
8. Lorain: +2,303
9. Warren: +2,198
10. Lucas: +2,194
11. Portage: +1,991
12. Delaware: +1,610
13. Athens: +1,586
14. Mahoning: +1,383
15. Wood: +1,026
16. Stark: +881
17. Lake: +729
18. Fairfield: +658
19. Clermont: +612
20. Medina: +578
21. Tuscarawas: +468
22. Wayne: +408
23. Licking: +404
24. Allen: +375
25. Miami: +359

Most Ohio counties saw increases in international migration, but once again, none came close to Franklin County’s total.

So there you have it, the updated numbers for Ohio’s counties.