
**Added data for the 2016 election.
With the presidential election just a few months ago, I thought it might be interesting to look at how Franklin County has voted over time. I went back to the presidential election of 1976 as that is the earliest I could find individual county totals.
First, let’s look at the total number of votes that were for the Democratic candidates vs the total number of votes for the Republican candidate.
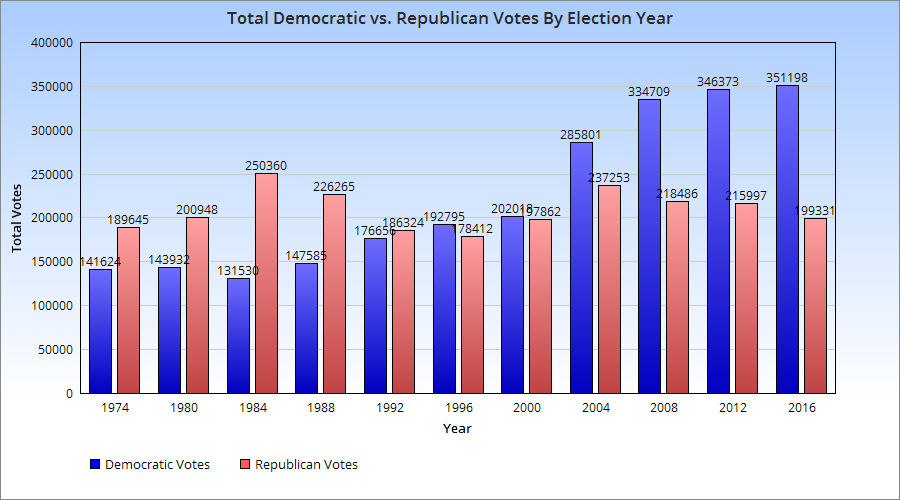
As the graph above shows, the number of Democratic votes has gradually been rising, and first surpassed Republican votes in the 1996 election. Meanwhile, Republican votes have more or less held steady, seeing no appreciable gains or declines over the course of the period of record.
What about votes as a %? For this, I was able to go back a bit further in the records.
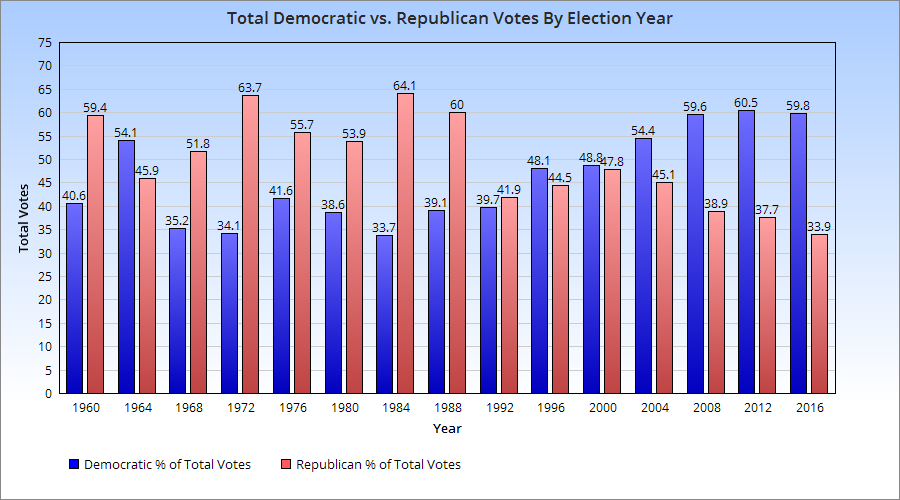
This graph shows a very similar story, only a bit more stark, with Republicans clearly losing its share of the vote over the period with Democrats gaining.
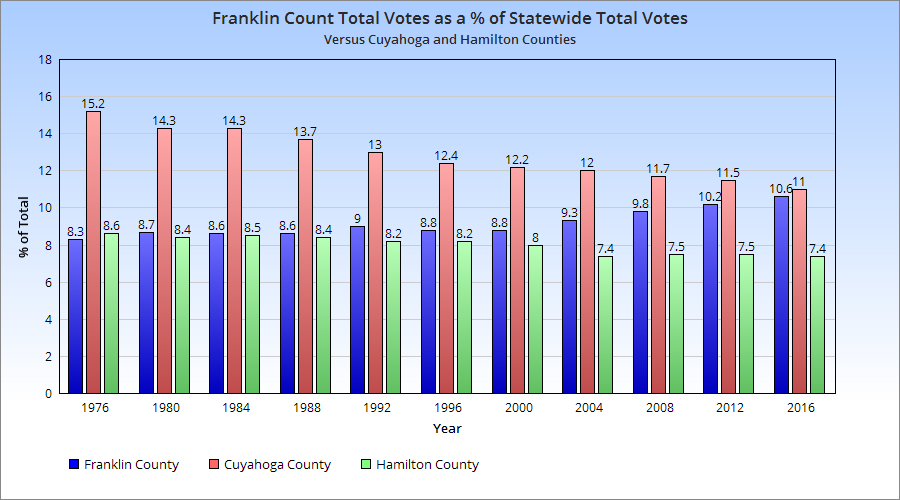
Not only are the voting habits of the county changing, but Franklin County’s share of the statewide vote is also growing. In the graph below, Franklin County is compared to Cincinnati’s Hamilton County and Cleveland’s Cuyahoga County showing the % share of total statewide votes for each. Franklin County’s has been steadily rising over time, while both other counties have lost some share over the period.
And it is also becoming a bigger player in the statewide % of Democratic votes.
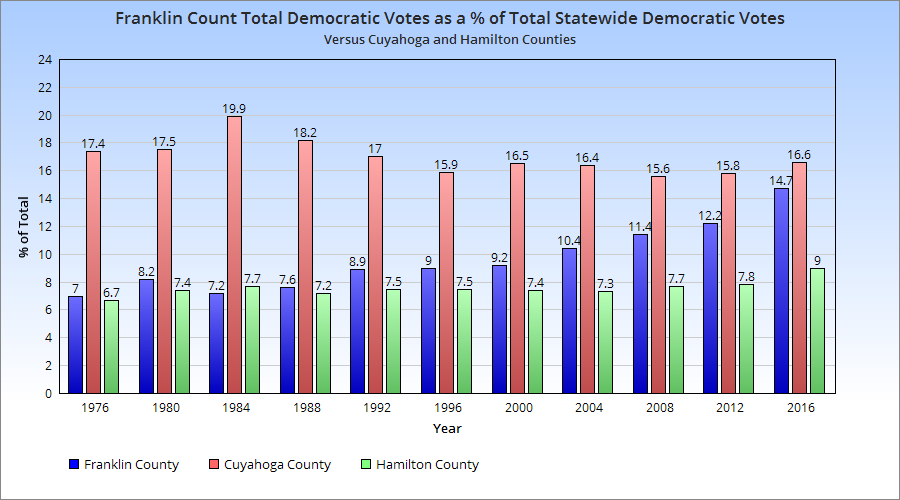
If these trends continue, Columbus’ Franklin County may end up passing Cuyahoga County not only as the most “Blue” county in the state, but the most influential county as well.