
Yesterday, I talked about how the 1950 core population had changed the last 50 years. Today I want to focus just on the Downtown, or the Central Business District. This is a much smaller area for all three cities so there are far fewer tracts involved.
First, let’s look at the total Downtown populations since 1950.
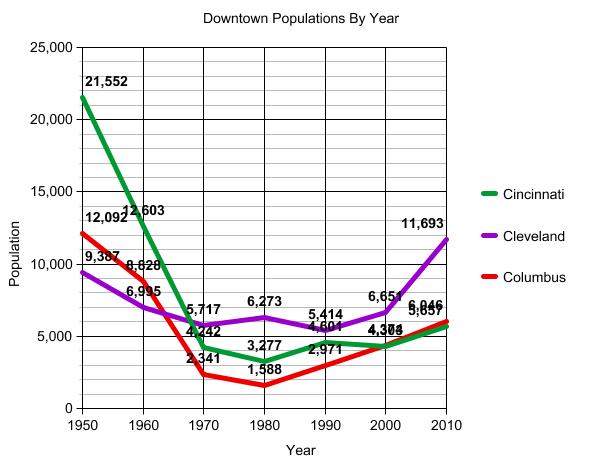
This graph, I think, will surprise most people. The first surprise is that downtown populations in 1950 were not nearly as high as most would have you believe. Cincinnati did have almost 22K people there, but even a city like Cleveland had less than 10K, and that was during the absolute peak of its city population. Another surprise is that Columbus was not always the lowest populated downtown and was more populated than Cleveland’s in 1950. Finally, the last surprise is that while all the downtowns are now growing, Columbus has regained 2nd place and Cleveland has seen the most growth so far.
What about tract trends for the downtowns? Well first, here are the population trends for each downtown.
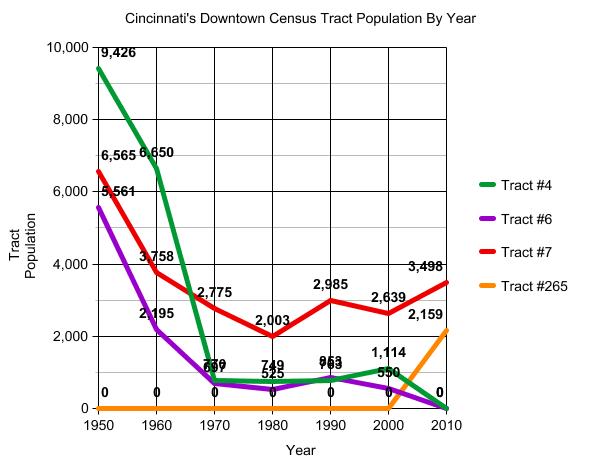
For Cincinnati, Tracts #4 and #6 were combined into #265 in 2010.
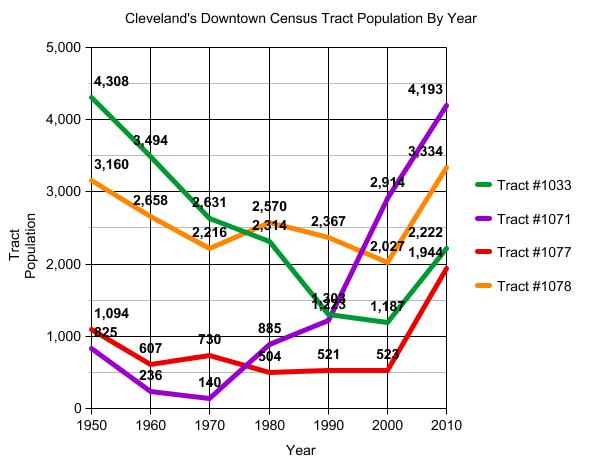
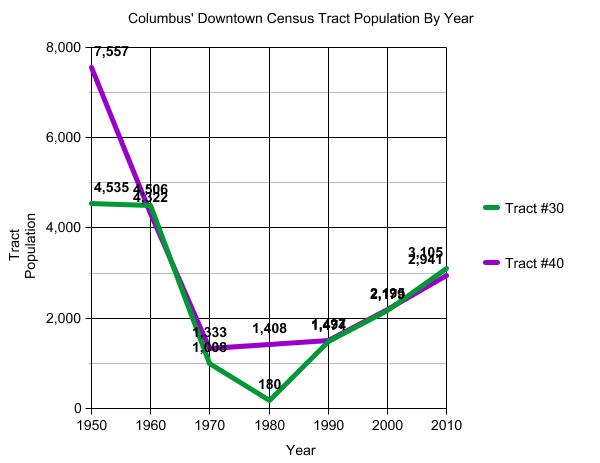
So no city had a single Downtown tract that was not growing in 2010. This is good news.
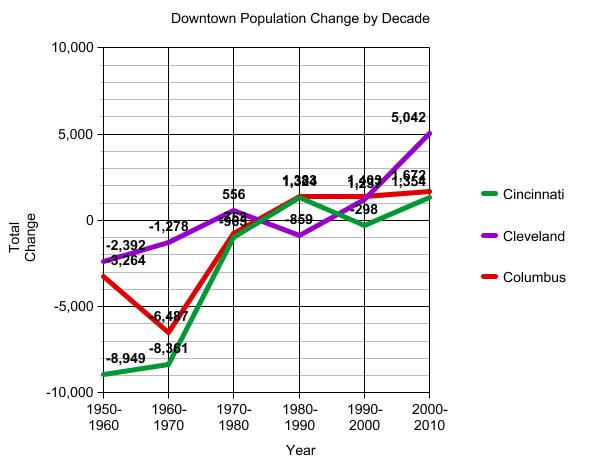
Here is the total population change by Downtown.
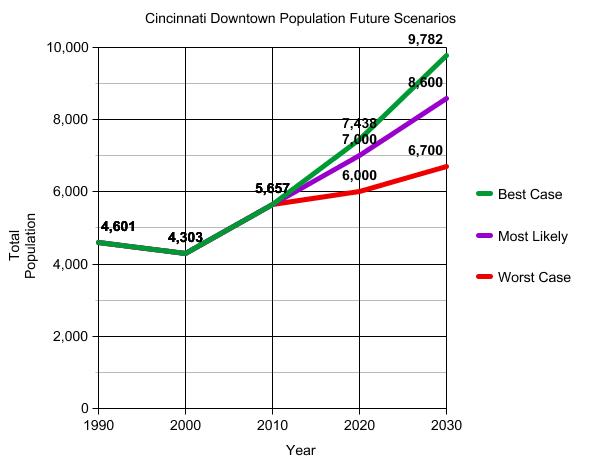
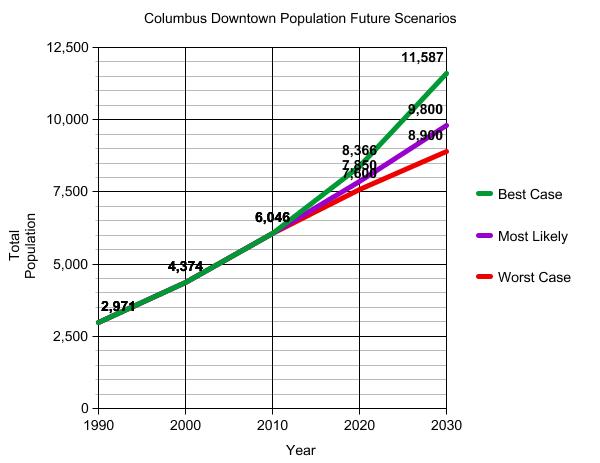
What about if these current trends continue, what might the downtown populations look like in 2020 or 2030?
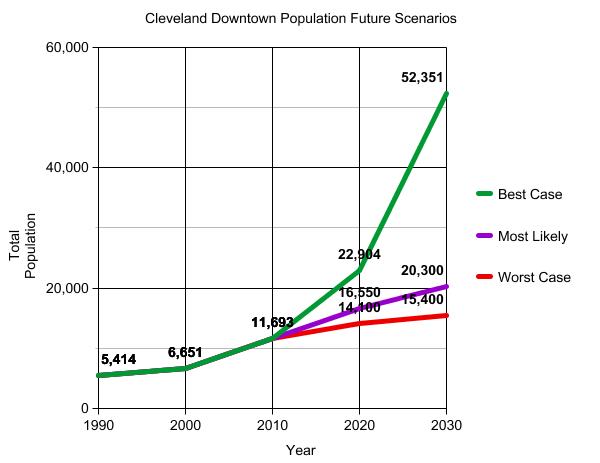
If you think Cleveland has a very rapid rise for its Best Case scenario, that is because, to get the best case, I used the last decade’s growth rates and just assumed they would continue and compound growth. One of Cleveland’s tracts had a growth rate over 80% while another grew 271%. Still, while it’s the best case, it’s also highly unlikely to maintain growth rates that high for that long, so a more likely case is somewhere closer to Most Likely.
Finally, I wanted to look at more of the downtown area than just the central business district. “Downtown” for many includes more areas than that and may be a “Greater Downtown Area”, the measurement between the full 1950 boundaries and just the CBD.
Here are the tracts I considered to be the Greater Downtown area for each city.
Cincinnati: 2, 9, 10, 11, 263, 264, 265, 268
Cleveland: 1033, 1036, 1042, 1071, 1077, 1078, 1082, 1083, 1084
Columbus: 21, 22, 29, 30, 36, 38, 40, 42, 52, 53, 57
And the graph for the population of these tracts since 1950 and a projection out to 2020.
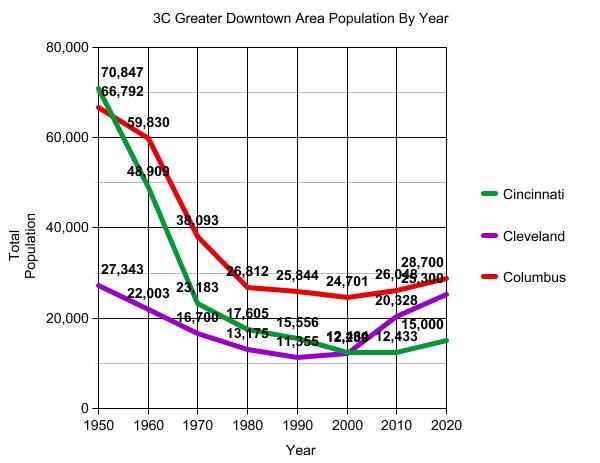
Cincinnati reached it’s lowest population for the past 60 years for this area in 2010, but just barely. It should be growing again by 2020, but I didn’t project the growth to be that high because it was still coming out of its lowest point. Cleveland’s greater downtown had the bottomed out in 1990 and had the fasted growth the past decade. Columbus managed to maintain the highest population in its greater downtown, bottomed out in 2000 and has grown since. However, not nearly as fast as in Cleveland. I expect Columbus to have better growth this decade and remain on top, but with Cleveland’s area closing the gap.