
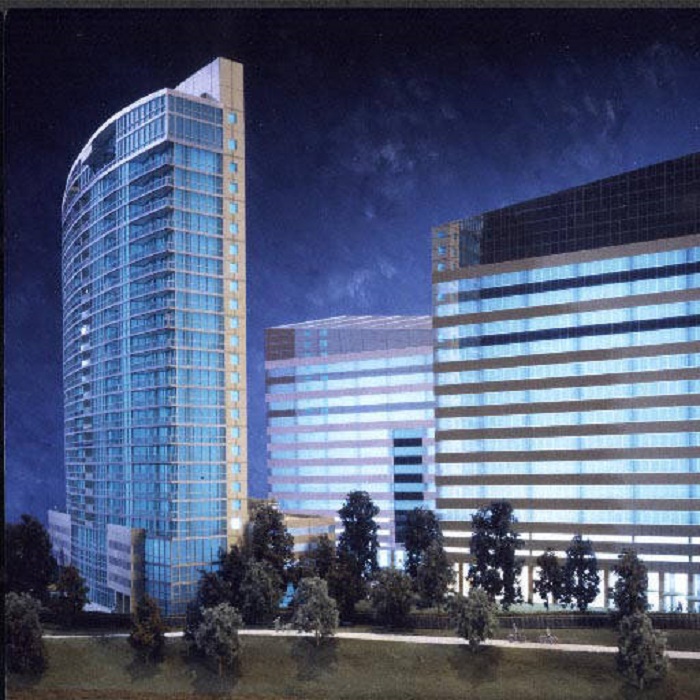
Rendering of Miranova in 1998.
On November 16, 1995, Developer Ron Pizzuti announced plans for a residential and office complex on the Scioto River shore on the southwestern edge of Downtown, a project that would eventually become Miranova Tower. In 1995, this area was a large vacant lot and a handful of small buildings. Originally, the $150 million plan called for replacing this whole area with two 25-story condominium towers, 14 luxury townhomes on the river, a 5-story office building and a pair of restaurants, all with construction to begin in 1996. 200 residential units were planned for the towers. This was all supposed to be part of a new series of Downtown developments including a new COSI, a new soccer stadium across the river on the Scioto Peninsula and a residential development on the Whittier Peninsula west of the Brewery District.
On May 12th, 1996, it was reported that the project would not actually break ground until sometime in 1997, already another year later than originally planned. The two towers remained on the agenda, as did the townhomes and restaurants, but the office building had gained a floor and would now be 6 stories.
By July 8th, 1996, the project had gotten larger still. The # of townhomes had more than doubled to 30 and the office building had risen to 7 stories.
On December 16, 1996, the office building once again grew, this time to 8 stories.
By February 4, 1997, the number of towers had fallen to just one, and mention of townhomes had disappeared, yet the price tag remained $150 million.
Further changes came on December 12, 1997. The single tower would be 28 stories and the office tower had grown to 16 stories. Groundbreaking was pushed back to sometime in 1998.
February 11, 1998, still a single 28 story condo tower, but now two 16-story office towers.
May 8, 1998, and back to just one office tower. Still no groundbreaking.
September 19, 1998, more changes. Condo tower down to 26 stories and the office building down to 15. But work has begun on pouring foundations
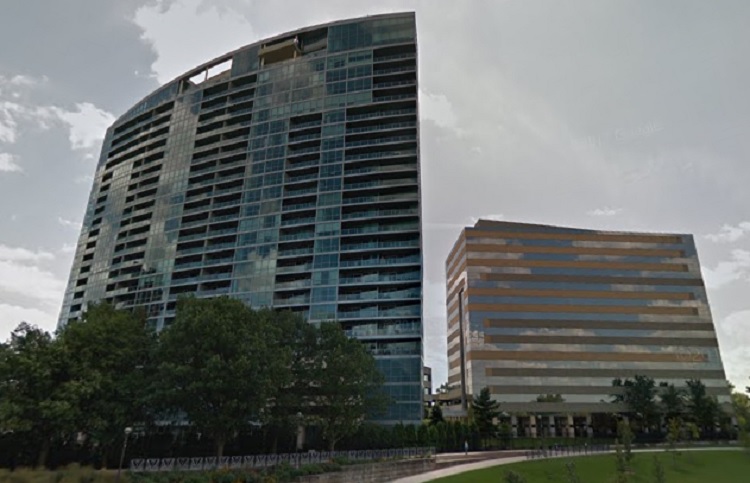
Miranova condo tower was completed in the early spring of 2000. By July, 79 of the 112 condos had sold. The office building, down to a final height of 12 stories, would not be finished until 2001. The last condo sale would not happen for several years, as the 2000s saw the market crash for these residences.
Miranova Project Stats
Began Construction in 1999
Completed in 2001
Cost: $150 Million
Height: 26 Stories
# of Residential Units: 112
Completed projects going back to the 19th Century, as well as new proposals, can be found at the Columbus Development links page. New proposals happen all the time, and you can follow the process for many of them on the Columbus Area Commissions website.